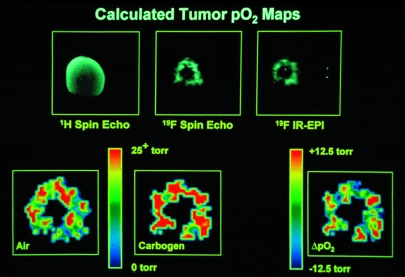
Figure 4.
Oxygen-tension mapping in a radiation-induced fibrosarcoma (RIF-1) tumor implanted on the lower back of a C3H mouse which received a 10 g/kg dose of perfluoro-15-crown-5-ether 4 days before imaging at 2.0 T. Upper Left: Coronal 1H spin-echo image of RIF-1 tumor, 256x256 pixel resolution, repetition time (TR) = 1 second, echo time (TE) = 25 msec, field of view (FOV) = 30 mm, slice thickness of 2 mm, 128 phase-encoding steps, number of averages (NEX) = 2. Upper Center: Coronal projection 19F spin-echo image of sequestered perfluoro-15-crown-5-ether in same tumor as in Upper Left, 128x128 pixel resolution, TR = 5 seconds, TE = 25 msec, FOV = 30 mm, 64 phase-encoding steps, NEX = 4, total image acquisition time = 21 minutes. Upper Right: Coronal projection 19F-inversion recovery-EPI of same tumor as in Upper Left, 64x64 pixel resolution, TR = 10 seconds, TE = 30 msec, inversion time (TI) = 80 msec, FOV = 30 mm, NEX = 8, total image acquisition time = 80 seconds. Lower Left: Calculated pO2 map (from seven IR-EPIs, like that shown in Upper Right, with TI values of 0.08, 0.20, 0.50, 1.0, 2.0, 4.0, and 8.0 seconds, respectively) for animal breathing air. Color indicates pO2 values from 0 to >25 Torr. Lower Center: Calculated pO2 map as in Lower Left, but with animal breathing carbogen (95% O2/5% CO2) for 15 minutes. Lower Right: Difference in pO2 map obtained by subtracting pO2 map in Lower Left from pO2 map in Lower Center (carbogen-air). Color scale now indicates change in pO2 from -12.5 to +12.5 Torr. Oxygen tension maps have been cropped to remove some of the background noise region shown in Upper Right. These data are from work performed by C. Sotak, with grateful acknowledgement to K. Helmer and M. Meiler.

