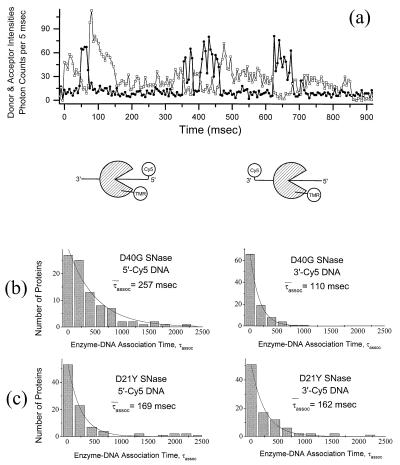
Figure 4.
(a) Emission time trace of a single TMR-labeled wild-type SNase molecule interacting with single Cy5-labeled 40-nt ssDNA molecule(s) (donor emission in squares, acceptor emission in circles). The donor signal decreases every time the acceptor signal increases (signifying the initiation of energy transfer) and vice versa (signifying the termination of energy transfer); this is direct evidence for spFRET. (b) Histograms of τassoc for D40G SNase with 5′-Cy5-ssDNA and 3′-Cy5-ssDNA. The average duration of the FRET signals measured from interactions between donor-labeled SNase and 5′-end acceptor-labeled substrate are longer (average = 257 msec) than those measured with 3′-end acceptor-labeled substrate (average = 110 msec). This difference is consistent with a SNase cleavage mechanism in which the 5′ cleavage product is released more slowly than the 3′ cleavage product, or the enzyme catalyzes cleavage processively in the 3′ to 5′ direction. (c) Histograms of DNA-SNase association times, τassoc, for cleavage-impaired D21Y SNase with 5′-Cy5-ssDNA (left; average τassoc = 169 msec) and 3′-Cy5-ssDNA (right; average τassoc = 162 msec). This control experiment demonstrates that fluorophore photophysics and statistical aberrations do not account for the differences in association times observed when using 5′- and 3′-end-labeled substrates with the cleavage-competent D40G SNase mutant.

