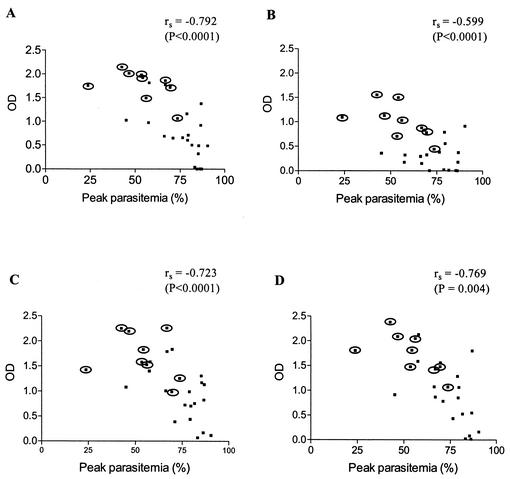
FIG. 5.
Scatter diagram showing the correlation between PyMSP4/5-specific antibody levels (OD) in prechallenge sera and peak levels of parasitemia in 31 mice orally immunized with different amounts of EcMSP4/5 with or without CTB. (A) Antibodies to full-length PyMSP4/5. (B, C, and D) Antibodies to MSP4/5A, MSP4/5B, and MSP4/5C, respectively. The sera were measured at dilutions of 1:10,000 against full-length PyMSP4/5 and 1:1,000 against the three PyMSP4/5 fragments. Circled points indicate mice that survived parasite challenge. Spearman's rank correlation coefficient (rs) and the associated P value are shown at the top of each graph.

