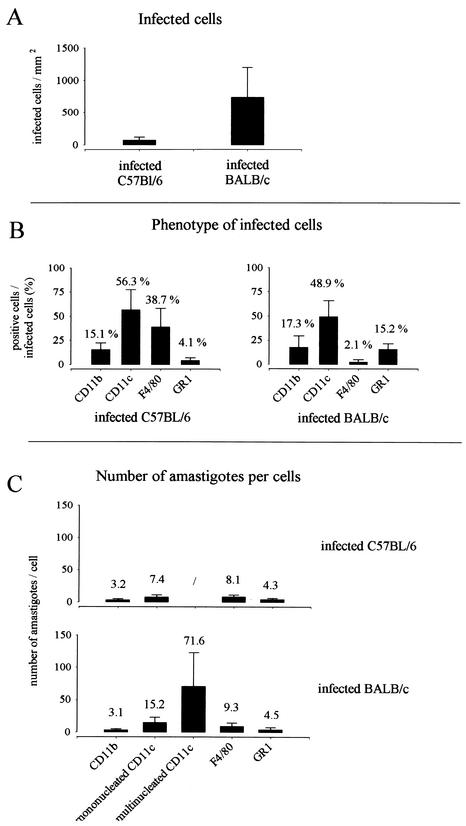
FIG. 4.
(A) Numbers of infected cells present in the lymph nodes after 4 weeks of infection. Each value represents the mean ± the SD of cell counts/mm2 of tissue of 20 sections from four mice. (B) Percentages of infected cells expressing CD11b, CD11c, F4/80, or GR1 in the lymph node. Each value represents the mean of percentage ± the SD of cell counts/mm2 of tissue of 10 sections from four mice. (C) Number of parasites in cells expressing CD11b, CD11c, F4/80, or GR1 present in the lymph nodes at 4 weeks of infection. Each value represents the mean ± the SD of cell counts/mm2 of tissue of 10 sections from four mice.

