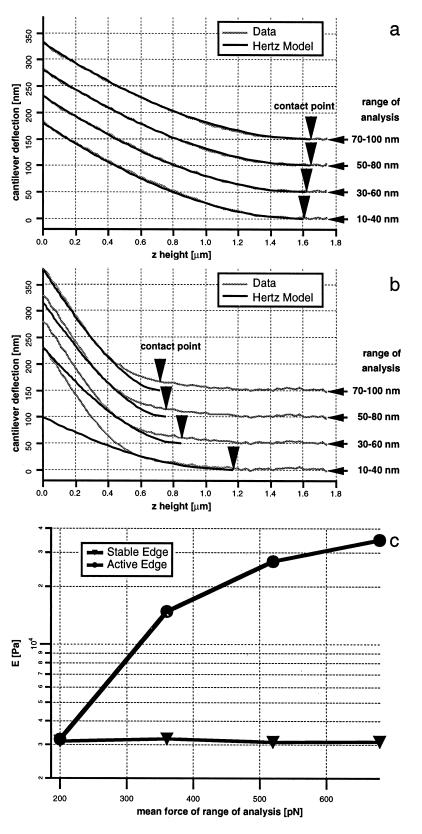
Figure 1.
(a) Typical force curve on stable edge fitted in four different deflection ranges showing good fit of the Hertz model to the data, which allows extraction of the E value and contact point that does not appreciably depend on the force range used for the fit. (b) Typical force curve on a thin part of a protruding edge fitted in four different deflection ranges showing that the curve can only be fit by the Hertz model in the lowest applied force regime. For a and b, cantilever deflection range used for the fit is shown in nm at right margin, arrows indicate zero deflection, calculated contact points are indicated by arrowheads, and values of E are given in c. (c) Dependence of E on the mean force of the force range used for analysis for stable and active edges of the cell.

