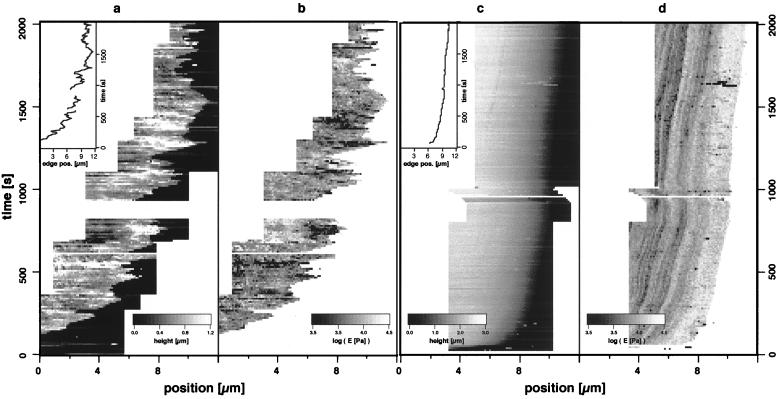
Figure 3.
Successive single line scans of height (a) and E (b) across the protruding edge of a motile 3T3 cell in which values are encoded in a gray scale. Inset in a shows position vs. time for a point on the margin, revealing fluctuations superimposed on a general protrusion. Successive single line scans of height (c) and E (d) of the stable edge of a 3T3 cell in which values are encoded in a gray scale. Inset in c shows position vs. time for a point on the margin. The band structure in the E plot presumably is caused by stress fibers crossing the scan line. Note the gradual extension.

