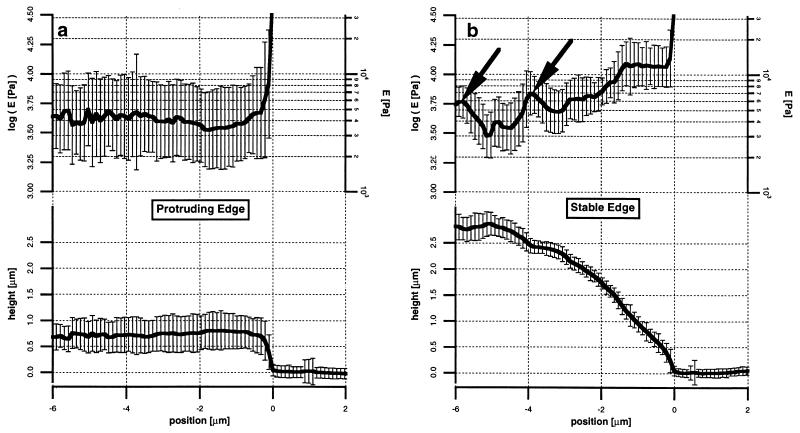
Figure 5.
(a, Upper) Average E as a function of position from the edge for protruding lamella. (a, Lower) Average cell thickness as a function of position from the edge for protruding lamella. (b, Upper) Average E as a function of position from the edge for stable margin. Arrows indicate distinct, local increases in apparent E for the stable edge that may correspond to stress fiber-like structures. (b, Lower) Average cell thickness as a function of position from the edge for the stable margin. Force curves analyzed in the cantilever-deflection range of 10–40 μm. Error bars represent the SD of the mean values of height or E at a given distance from the edge.

