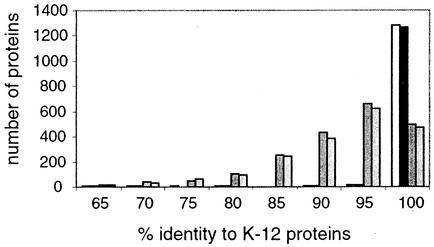
FIG. 3.
Comparison of backbone proteins. E. coli K-12 proteins with orthologs in all four pathogens (S. flexneri, E. coli O157: H7, and S. enterica serovars Typhi and Typhimurium), were aligned with each pathogen ortholog, and the percentage of identity was calculated. The results are plotted as a histogram. White bars, S. flexneri; black bars, O157: H7; dark gray bars, S. enterica serovar Typhimurium; light gray bars, S. enterica serovar Typhi.

