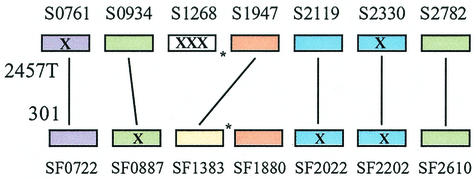
FIG. 5.
Diagram of the organization of ipaH genes in the 2457T and 301 genomes. Lines connect genes in the same positions relative to backbone. X marks genes inactivated by insertion sequences or frameshift mutations. Similar colors denote homology of the N-terminal portions of the encoded proteins. Asterisks show the relative positions of the terminus of chromosomal replication; a chromosomal rearrangement in 2457T spanning the terminus accounts for S1947 having the same flanking backbone regions as SF1383. The figure is not drawn to scale.

