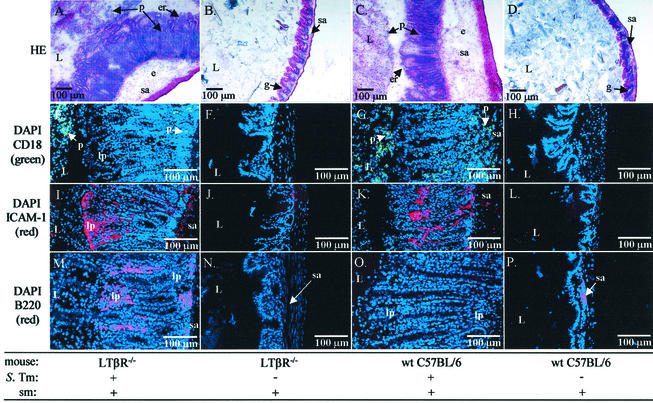
FIG. 14.
Cecal inflammation in serovar Typhimurium-infected LTβR−/− and wild-type C57BL/6 mice. Representative images of the ceca of the LTβR−/− and wild-type C57BL/6 mice from the experiment in Fig. 13 are shown. Each cecum was cryoembedded, and 5-μm thin sections were stained with H&E (A to D) or processed for immunofluorescence microscopy (E to P). (A, E, I, and M) Streptomycin-pretreated LTβR−/− mice infected with serovar Typhimurium; (B, F, J, and N) streptomycin-pretreated LTβR−/− mice mock infected with PBS; (C, G, K, and O) streptomycin-pretreated wild-type C57BL/6 mice infected with serovar Typhimurium; (D, H, L, and P) streptomycin-pretreated wild-type C57BL/6 mice mock infected with sterile PBS. In panels A to D, the cecum sections of LTβR−/− and wild-type C57BL/6 mice were stained with H&E. In panels E to H, infiltration and transmigration of CD18+ cells is shown. Cecum sections were stained with DAPI, rat α-mouse CD18, and α-rat IgG-FITC antibodies (DNA = blue; CD18 = green). In panels I to L, induction of ICAM-1 expression is shown. Cecum sections were stained with DAPI, hamster α-mouse ICAM-1, and α-hamster IgG-TRITC antibodies (DNA = blue, ICAM-1 = red). In panels M to P, the distribution of B220high B cells is shown. Cecum sections were stained with DAPI, rat α-mouseB220, and α-rat IgG-TRITC antibodies (DNA = blue, B220 = red). L, intestinal lumen; e, edema; p, PMN; er, erosion or ulceration of the epithelial layer; g, goblet cell; sa, submucosa; lp, lamina propria; c, crypt. Magnifications are indicated by bars. “S. Tm + or −” indicates whether the mice were infected with serovar Typhimurium SL1344 or mock infected with sterile PBS; “Sm + or −” indicates whether the mice were pretreated with streptomycin or with water.

