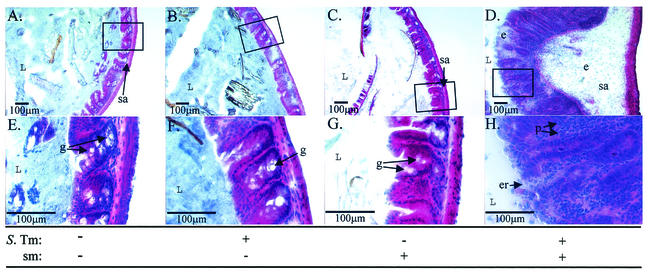
FIG. 5.
Cecal inflammation at 2 days p.i. The ceca of five of the six animals from each group of the experiment shown in Fig. 3 were cryoembedded, and 5-μm thin sections were stained with H&E for histopathological analysis. (A and E) Cecum of a water-pretreated mouse mock infected with PBS; (B and F) cecum of a water-pretreated mouse infected with serovar Typhimurium; (C and G) cecum of a streptomycin-pretreated mouse mock infected with PBS; (D and H) streptomycin-pretreated mouse infected with serovar Typhimurium. The images are representative for all animals from each group. Boxes in panels A, B, C, and D indicate the area shown at the higher magnification. L, intestinal lumen; e, edema; p, PMN; er, erosion of the epithelial layer; g, goblet cell; sa, submucosa. Magnifications are indicated by the black bars.

