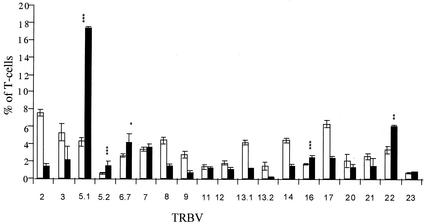
FIG. 2.
TRBV profile of rSEL. Peripheral blood mononuclear cells from five study subjects were stimulated with either anti-CD3 (white bars), which stimulates all T cells, or rSEL (black bars), which selectively stimulates T cells dependent on the TRBVs. Cells were stained with monoclonal antibodies against listed TRBVs, and the results were evaluated by flow cytometry. The percentages of T cells expressing the listed TRBVs are shown. Results from all five study subjects are reflected in each case, except for those for TRBV 6.7, which are the averages of four of five study subjects (results for the fifth study subject were not obtained). P values were determined by using the paired Student t test (∗, P = 0.046; ∗∗, P = 0.009; ∗∗∗, P < 0.003). Error bars represent the standard errors for each data set.

