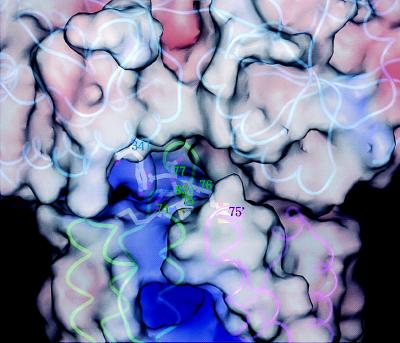
Figure 4.
Closeup view of the Tar apical loops and the MBP substrate-binding cleft. The image has been rotated 180° about the long axis of the Tar dimer relative to the image in Fig. 3 A and B because this vantage point gives a better view of the relevant residues. Polypeptide backbones are shown in cyan (MBP), green (subunit T of Tar), and magenta (subunit T′ of Tar). Molecular surfaces are color-coded by electrostatic potential. Side chains are shown for key residues. Positive potential in MBP centers on Tyr-341, which is surrounded by Met-74, Met-75, Met-76, Asp-77, and Ser-83 in T and Met-75′ in T′. Additional positive charge in this region would be expected to destabilize the complex. No substitutions at Met-74 that specifically disrupt maltose taxis have been found (19), perhaps because a positively charged residue next to Arg-73 would interfere with folding and render Tar unstable. Note the intensely positive aspartate-binding site (middle bottom).

