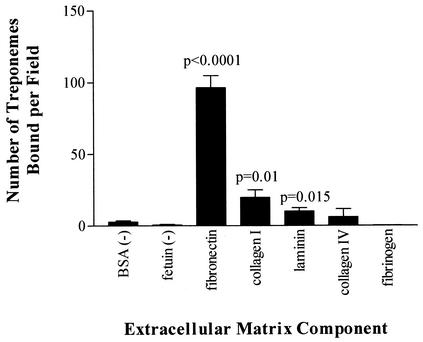
FIG. 1.
T. pallidum attachment to various ECM components. Each bar represents the average number of treponemes bound ± the standard deviation for six microscopic fields, and the results are representative of three independent experiments. For statistical analyses, attachment to each ECM component was compared to attachment to the negative control BSA by the Student two-tailed t test.

