Figure 1.
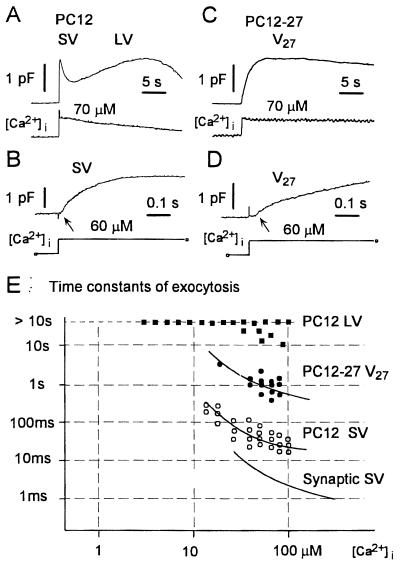
Capacitance measurements of exocytosis induced by photolysis of the caged compound DM-nitrophen in wild-type PC12 (A and B) and defective PC12-27 (C and D) cells. (A and C) Capacitance changes displayed in a compressed time scale. Lower traces indicate [Ca2+]i measured by using the fluorescent dye benzothiazole coumarin. Wild-type PC12 cells (A) show the typical pattern composed by fast and slow exocytoses, each of which is followed by recycling. SV and LV labeling refers to predicted contribution of the corresponding vesicles. In contrast, PC12-27 cells (C) display mainly a single, slower response (V27), not followed by fast recycling. (B and D) Capacitance increases recorded with a high time resolution in wild-type PC12 and PC12-27 cells, respectively. In the wild-type cell, the capacitance increase begins after a short delay (≈10 msec; arrow in B). This increase is approximated by using an exponential function with a time constant of 60 msec. In PC12-27 cell, the capacitance increase becomes appreciable after ≈35 msec (arrow in D). The increase can be fitted by using the sum of two exponential functions with time constants of 44 msec and 1.1 sec, accounting for the 14 and 86% of the response in PC12-27, respectively. E illustrates the Ca2+ dependence and time constants of exocytoses in wild-type and defective PC12, compared with values in synapses. The smooth line for synaptic SV is from ref. 21.

