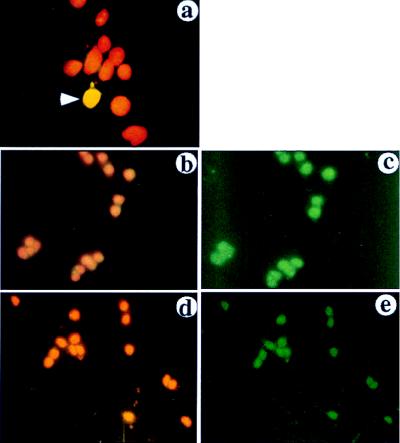
Figure 5.
Immunofluorescence analysis of FOG-2 expression. Cells were stained with α-FOG-2 antibody followed by a fluorescein isothiocyanate-conjugated antibody (green), and nuclei were counterstained with propidium iodide (red). Staining was visualized through a triple-filter (4′,6-diamidino-2-phenylindole/fluorescein isothiocyanate-conjugated/Texas Red, Omega Engineering, Stamford, CT) to detect both the FOG-2 protein and the nuclear staining (a, b, and d) or a single filter to detect FOG-2 only (c and e). (a) 293 cells transiently transfected with FOG-2 expression plasmid. Arrowhead indicates a transfected cell in the field. (b and c) PC12 cells. (d–e) Granule neurons of cerebellum.

