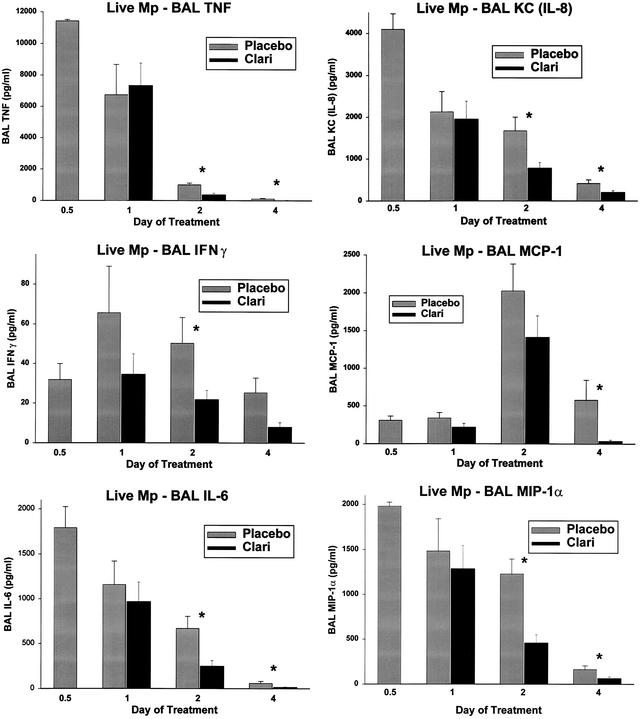
FIG. 3.
Cytokine and chemokine concentrations in BAL specimens from mice inoculated with live M. pneumoniae (Mp) and treated with clarithromycin or placebo for 1 to 4 days. Treatment began 12 h after inoculation (0.5 day on the x axis). For each pair of bars, placebo treatment is shown on the left and clarithromycin (Clari) treatment is shown on the right. Values shown are the means ± standard errors (error bars) (n = 5 to 7 for clarithromycin data; n = 5 for placebo data). Values for the clarithromycin and placebo treatments that are significantly different from each other (P ≤ 0.05) are indicated by an asterisk.

