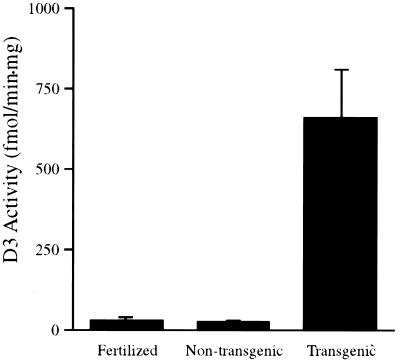
Figure 2.
The D3 enzymatic activities in extracts of 1-wk-old normal fertilized, pCS2+GFP-D3 nontransgenic siblings and pCS2+GFP-D3 transgenic tadpoles. Transgenic tadpoles were screened by GFP fluorescence. Values shown are the average of five individual animals in each group. The error bar represents SD.

