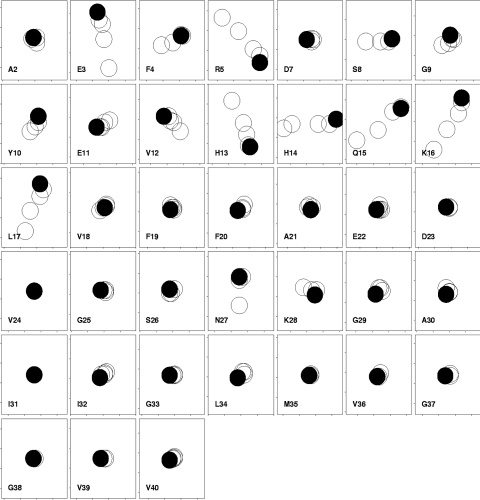
Figure 3. Chemical shift changes in Aβ-(1–40) on addition of GM1 to 200 μM peptide in water.
Each box shows results for a different residue, with 1H shifts horizontal (increasing left to right, total range ±0.02 p.p.m.) and 15N shifts vertical (increasing bottom to top, total range ±0.1 p.p.m.). This representation therefore resembles the change seen in an HSQC spectrum, except that the directions of the axes are reversed. The start of the titration is indicated with a filled circle, and subsequent titrations are 1, 2, 4 and 8 equivalents of GM1. The size of the circles approximates the experimental uncertainty. No data are shown for His6 because it could not be observed. Single-letter amino acid codes are used.

