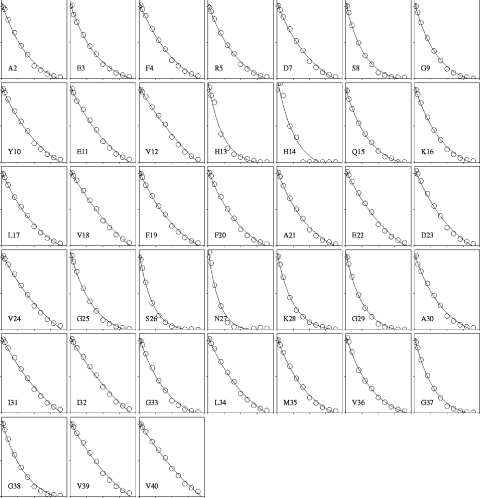
Figure 7. Intensity changes of HSQC peaks on addition of GM1 micelles to Aβ-(1–40).
The horizontal scale shows the molar ratio of GM1 to Aβ, with for each residue a range of 0–40 molar equivalents: the data are shown for 0, 1, 2, 4, 8, 12, 16, 20, 24, 28, 32 and 36 equivalents. The vertical scale shows the peak intensity relative to that in pure peptide, on a range from 0 to 100%. The intensity changes are fitted to an exponential decay. Single-letter amino acid codes are used.

