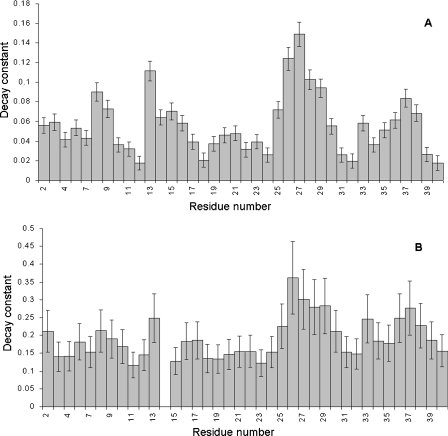
Figure 8. Loss of intensity during the titrations of (A) GM1 and (B) asialo-GM1 into Aβ-(1–40).
The bars show the decay constant from the exponential fits of the experimental data (Figure 7), with the estimated fitting error. The numerical values of the decay constants therefore have no direct meaning, but serve as a measure of the extent of intensity loss during the titration. Data for His14 are not shown in (B) because the intensity of His14 is too weak to allow fitting of the data.

