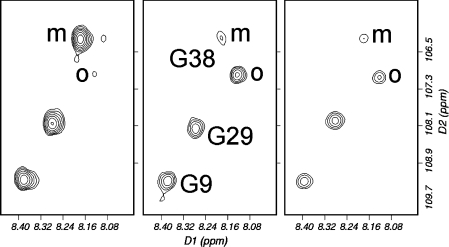
Figure 9. Titration of GM1 into Aβ-(1–42).
HSQC spectra of Aβ-(1–42) alone (left), with 8 molar equivalents of GM1 (centre) and 16 molar equivalents (right). The spectra were acquired sequentially, approx. 6 h apart. The signals for Gly9 and Gly29 are barely affected. The signal for Gly38 is also not affected by the addition of GM1, but there is an independent and time-dependent loss of the signal from monomer (marked m) and increase of a signal from an oligomeric species (marked o). All signals are starting to decrease in the final spectrum because of precipitation of aggregates. Single-letter amino acid codes are used.

