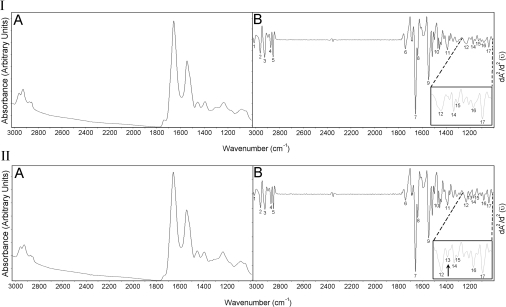
Figure 1. Absorption (IA) and second derivative (IB) spectra of the control left ventricle myocardium; absorption (IIA) and second derivative (IIB) spectra of the control vein.
Enlarged form of the spectra, in 1000–1270 cm−1 regions, are shown on the right sides of the Figures displaying the second derivatives. Absorption maxima appear as minima in the second derivatives.

