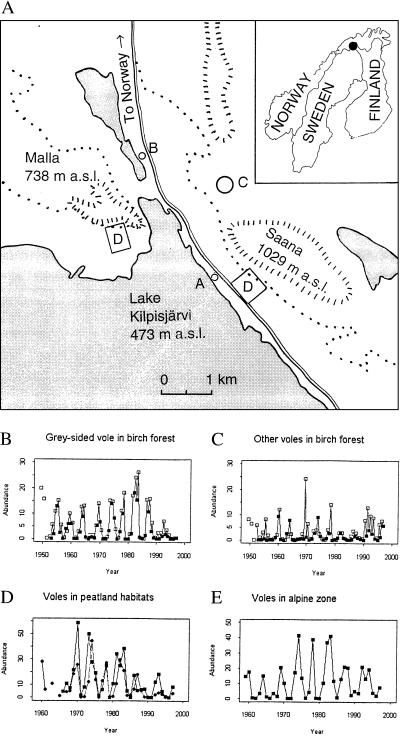
Figure 1.
Rodent dynamics at Kilpisjärvi. (A) Map of the study site. The trap lines at our main study sites in the subalpine birch forest are at the two locations marked D. Additional data from two productive peatland sites marked A and B and from an alpine site marked C were used. m a.s.l., meters above sea level. (B–E) Time series of rodent-trapping indices (voles per 100 trap nights). The abundance of gray-sided voles (B) and the abundance of other voles (C) are indicated for the sites marked D. Filled squares are spring densities, and open squares are fall densities. The gray-sided vole has been less abundant since about 1989. This reduced presence is associated with increased presence of the subordinate red vole, which previously had not been very common, and with the absence of clear peaks in total abundance. Before 1989, instances of low relative density of the gray-sided vole usually were associated with lemming outbreaks. The more pronounced lemming peaks in this series occur in 1960, 1969–1970, and 1978. (D) Summer abundance of voles in the two peatland sites. Squares refer to site A, and circles refer to site B. (E) Summer abundance of voles in the alpine region (site C).

