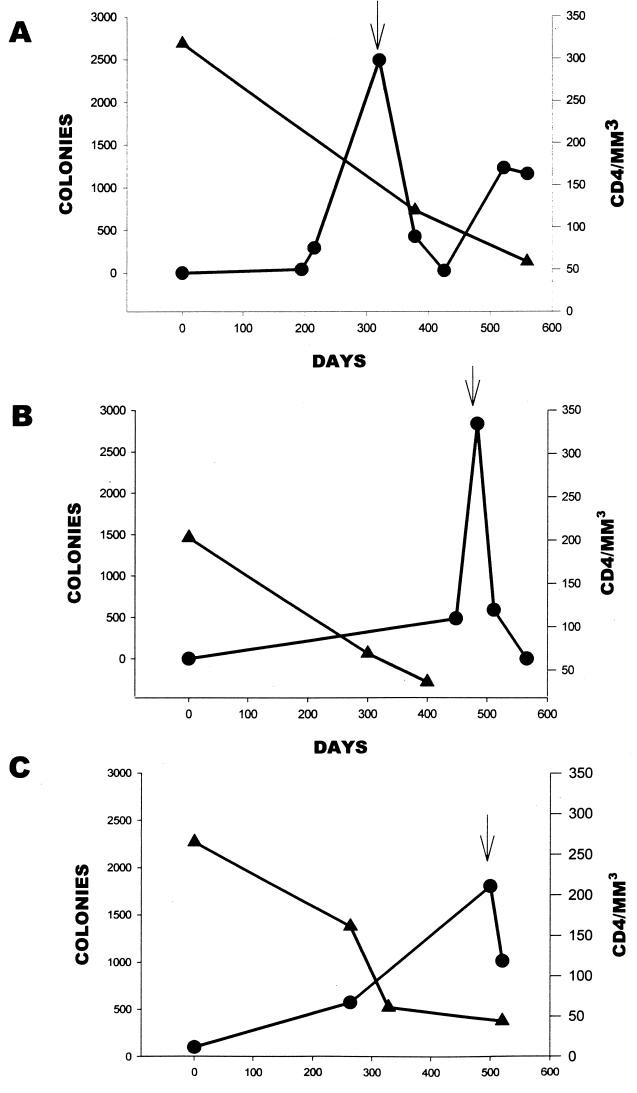
FIG. 2.
Relationship of CD4+-cell count to Candida colonization in patients I1(A), I2 (B), and I3 (C). The left y axis corresponds to number of colonies over time and is represented by the line graph with the circles. The right y axis corresponds to CD4+-cell count over time and is represented by the line graph with the triangles. The arrow represents the development of oral thrush for each patient.

