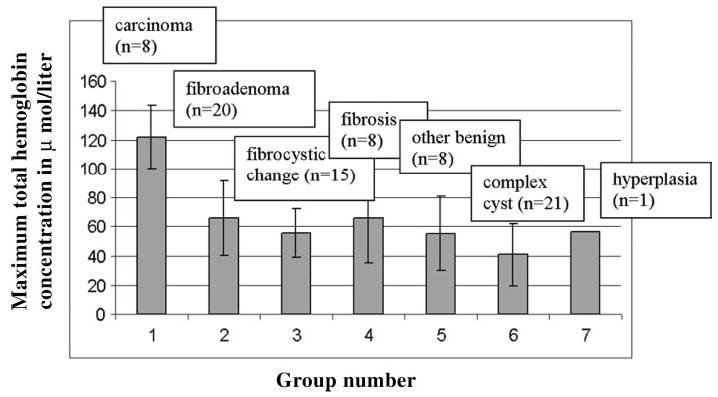
Figure 2.

Bar graph demonstrates average maximum total hemoglobin concentration obtained in seven groups. Group 1 represents carcinoma (121.6 μmol/L ± 26.8); group 2, fibroadenoma (65.9 μmol/L ± 25.5); group 3, fibrocystic changes (55.6 μmol/L ± 16.6); group 4, fibrosis (66.2 μmol/L ± 31.2); group 5, other solid benign lesions (55.2 μmol/L ± 25.2); group 6, complex cysts (40.7 μmol/L ± 21.3); and group 7, hyperplasia (56.2 μmol/L ± 0.0). Horizontal axis represents group number, and vertical axis represents maximum total hemoglobin concentration in micromoles per liter. Error bars indicate standard deviations.
