
Fig. 1.
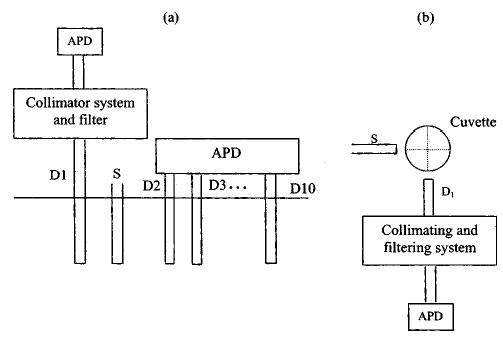
Distribution of source and detector fibers. (a) An infinite geometry. D1 is connected to a collimating and filtering system. The emission signal is detected by an APD detector. Fibers D2 to D10 are directly connected to APD detectors to measure the excitation signals for calculating absorption and reduced scattering coefficients of the medium. (b) A cylindrical measurement geometry viewed from the top. The inner radius is 1 cm and outer radius 1.2 cm. Source and detector are located in the same plan with an approximately 90-deg angle.