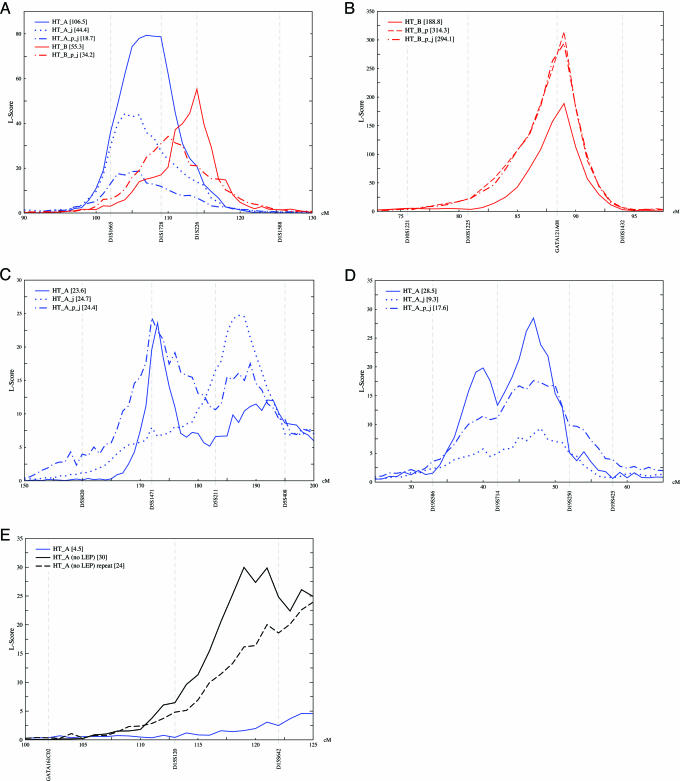
Fig. 1.
HT loci. L-scores are on the y axis; cM (Marshfield) and markers are on the x axis. Model.HT_A (in blue), HT corrected for environmental covariates (gender, parity, smoking, and age) and LEP; Model.HT_A (no LEP) (in black), same corrections as Model.HT_A but not LEP; Model.HT_B (in red), HT corrected for environmental covariates and WT, HIP, WST, LEP, FBS, SBP, DBP, TC, TG, and apoA-I and apoB levels. _p denotes polygenic correction and _j denotes joint chromosome analysis. (A) Chromosome 1. (B) Chromosome 10. (C) Chromosome 5. (D) Chromosome 19. (E) Chromosome 15.

