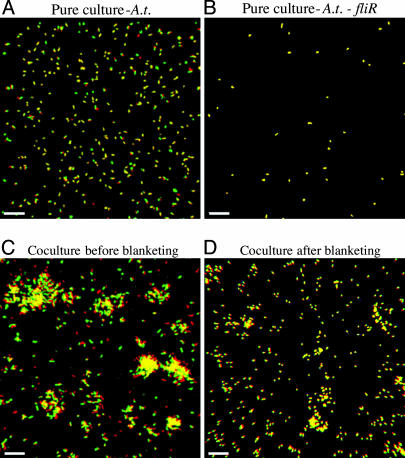
Fig. 6.
Different biofilm time-lapse microscopy series. Yellow cells indicate bacteria that have not moved during the course of the time series. Green cells indicate bacteria that were present in the field of view at the beginning of the time course but not at the end. Red cells are bacteria present at the end of the time series that were not present at the start. (A and B) A 1-h time course of a newly inoculated pure-culture biofilm of wild-type A.t. (A) or A.t.-fliR (B). (Scale bar, 12 μm.) (C and D) A time course of wild-type A.t. in coculture with P.a. (P.a. cells are not visible). (C) A 3-h time course before blanketing has occurred. (D) A 3-h time course after complete blanketing has occurred. (Scale bar, 20.2 μm.)

