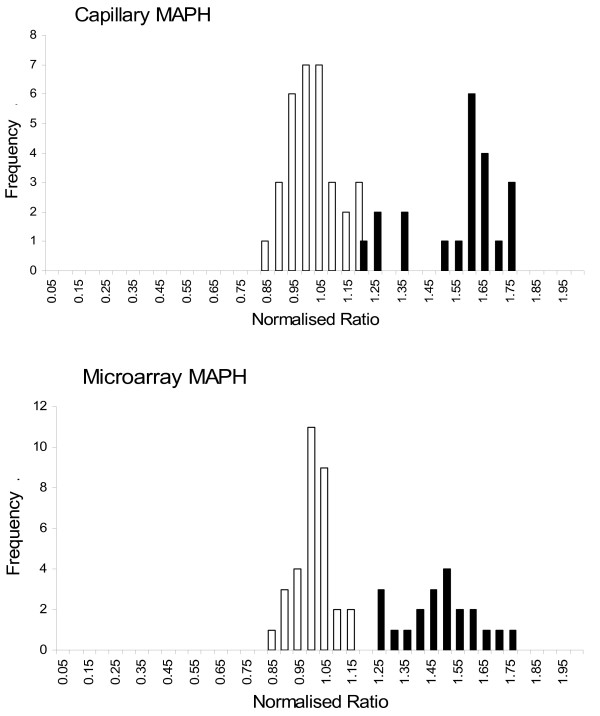
Figure 3.

Distributions of copy number scores, comparing capillary and microarray MAPH. Histograms of values for normalised copy number, using the "MRD6" values described, for measurements using capillary MAPH (upper) or microarray MAPH (lower). White bars show the normal group and black bars the duplicated (CMT1A) group.
