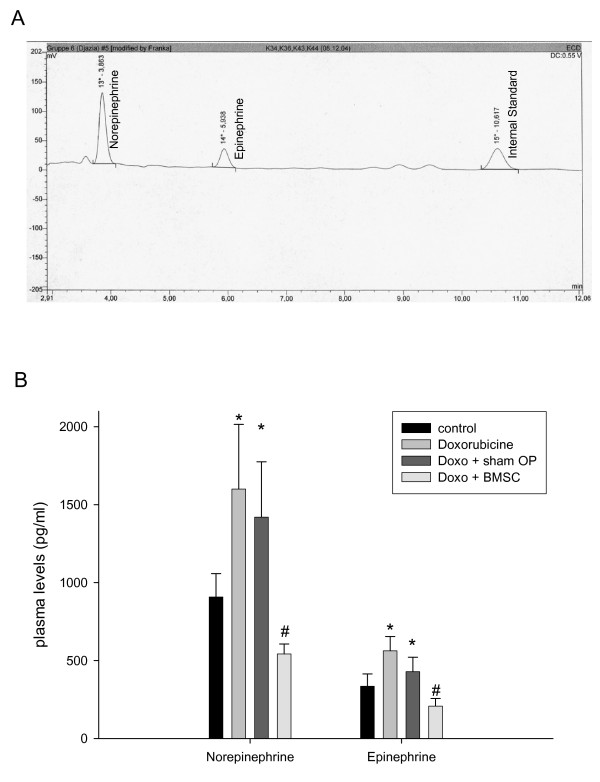
Figure 5.
upper panel (A): original plot showing electrochemical detection of norepinephrine, epinephrine and internal standard in rabbit plasma. lower panel (B): Quantitative data for plasma catecholamines in normal rabbits, in rabbits with doxorubicine-induced heart failure, rabbits suffering from heart failure after sham-operation, and BMSC transplanted rabbits with failing hearts, given as MEANS ± SEM of n = 6 rabbits in each group. Significant differences versus normal animals are indicated by a * (p < 0.05), while significant changes versus sham-operated rabbits are indicated by a # (p < 0.05).

