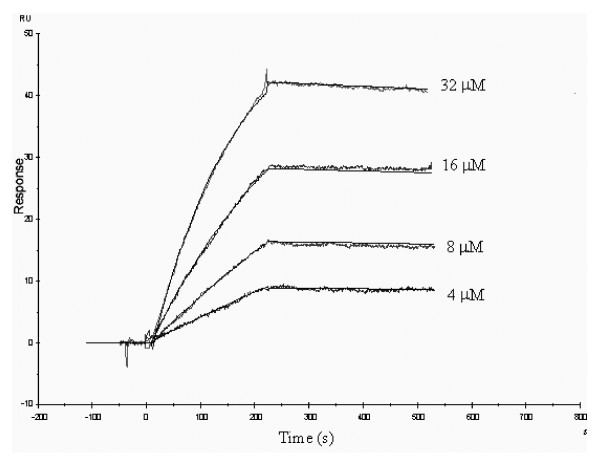
Figure 3.
Real-time binding of Cry11Ba to An. quadrimaculatus APNAnq 100. Experimental curves (jagged line) are shown overlaid with fitted curves (smooth line) obtained with the 1:1 Langmuir binding with drifting baseline model. The overlaid BIAcore response curves are shown for Cry11Ba toxin injections at 4, 8, 16, 32 μM as indicated.

