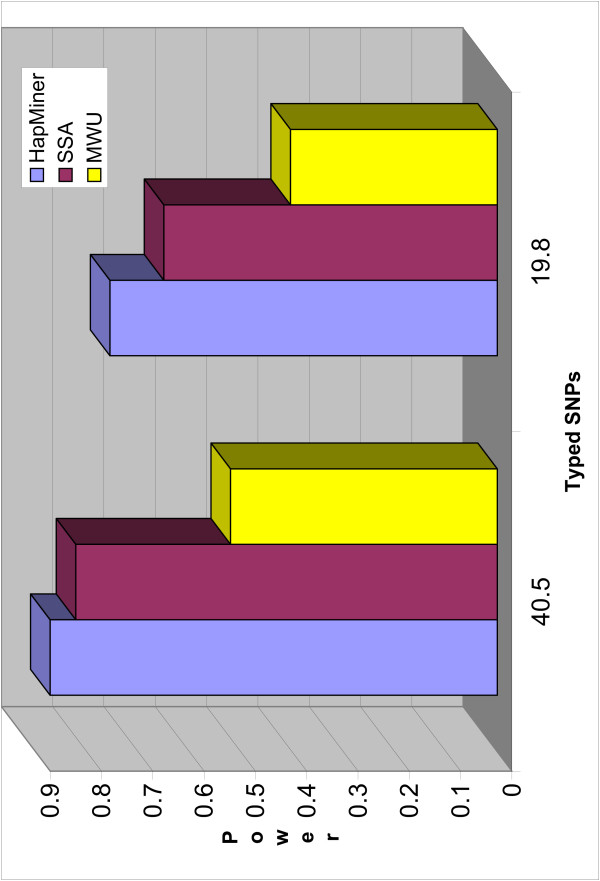
Figure 4.

Power vs Marker density. The power of three methods as a function of the marker density, average over three recombination rates. The sample size is 750 and the QTN effect π = 0.1. The number of markers is the average number of SNPs (allele frequency ≥ 5%) over 200 replicates.
