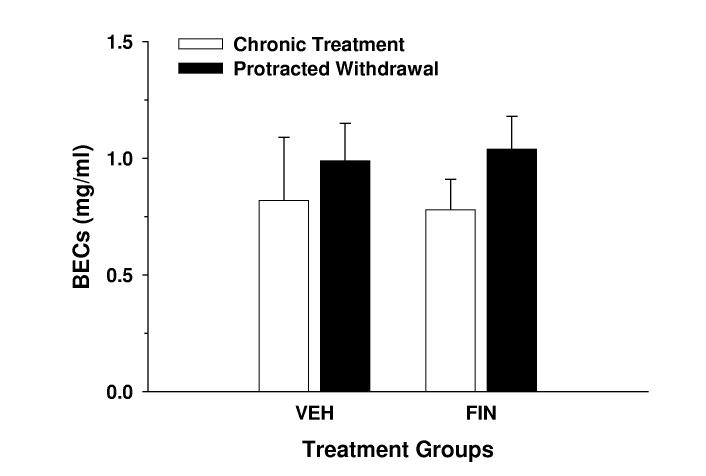
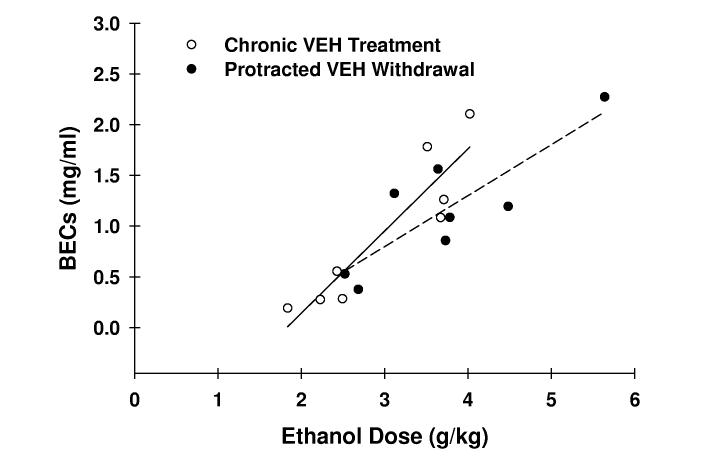
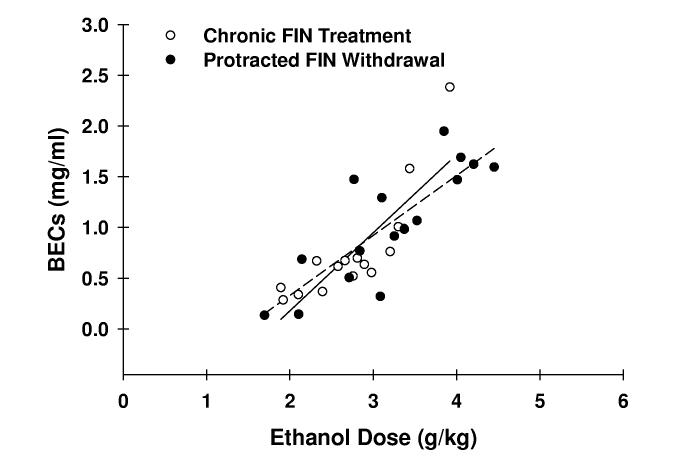
Fig. 2.
BECs during chronic finasteride treatment and protracted withdrawal. In panel A, the mean ± SEM of BECs are depicted for VEH-treated (n = 8) and FIN-treated (n = 16) mice and represent levels determined at the conclusion of the 2-hr drinking session on finasteride treatment day 7 and on withdrawal day 7. The relationship between BEC and ethanol dose in VEH- (panel B; n = 8) and FIN-treated mice (panel C; n = 16) was also assessed. The solid and dashed lines denote linear regressions for the chronic treatment and protracted withdrawal phases, respectively.


