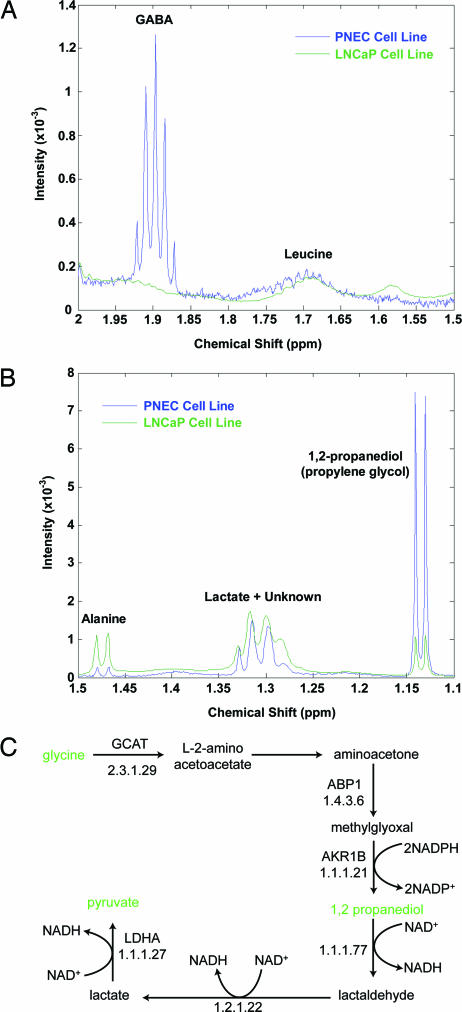
Fig. 1.
MAS-NMR spectroscopy studies. (A) Spectra were obtained from PNEC and LNCaP cell lines. A portion of the spectrum is shown from 1.5–2.0 ppm, highlighting enrichment of the GABA multiplet in PNEC compared with LNCaP cells. (B) Propylene glycol is enriched in PNEC cell lines. Metabolites were identified by proton correlation spectroscopy and by referencing NMR spectral libraries (Chenomx Eclipse software). (C) Transcriptome-based in silico metabolic reconstruction, showing the predicted pathway for propylene glycol synthesis and metabolism in PNEC cells.

