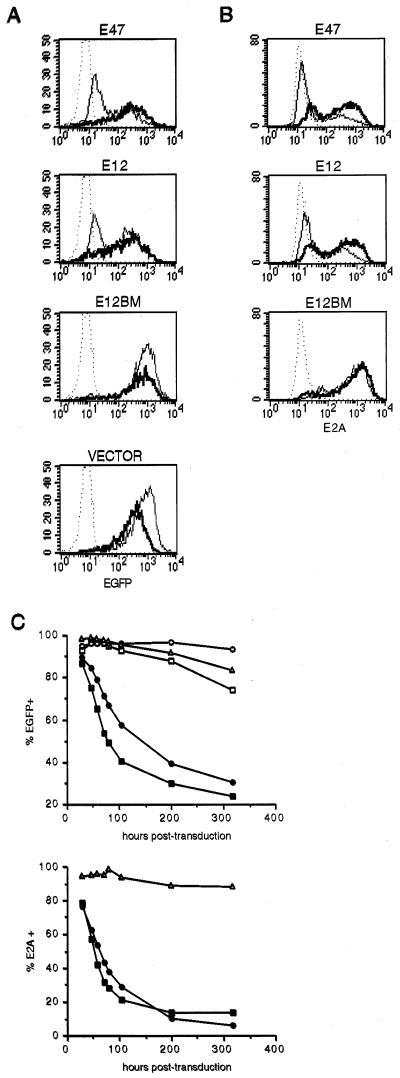
Figure 1.
Flow cytometric analysis of 1.F9 transductants. (A) Histograms representing EGFP fluorescence from cells transduced with viral supernatants containing E47, E12, E12BM, or vector control virus, comparing samples harvested and fixed 24 hr (thick lines) and 87 hr (thin lines) after transduction with that of untransduced cells (dotted lines). All overlaid histograms compare samples taken from the same transduced population, and all data were collected in the same FACScan session. Note that the numbers of events represented in each histogram are not the same. (B) Histograms depicting the expression of E2A in transduced populations as determined by staining fixed and permeabilized cells with mouse anti-human E2A antibody followed by goat-anti-mouse Ig-FITC, comparing samples harvested 24 hr (thick lines) or 72 hr (thin lines) after viral transduction with that of vector control transductants (dotted lines). All samples were stained and analyzed at the same time, and all histograms compare cells harvested from the same transduction. Each histogram represents 5,000 events. EGFP is lost from the cells on permeabilization, thus simplifying the analysis for E2A protein. (C) Time course of EGFP and E2A expression in viral transductants. Cells harvested at various times after transduction with vector control (open squares), antisense E12 (open circles), E47 (filled squares), E12 (filled circles), or E12BM (open triangles) viral supernatants were analyzed for EGFP expression or fixed, permeabilized, and stained for E2A. After flow cytometry data were collected, the percentage of cells with significant EGFP (Upper) and E2A (Lower) was determined and plotted. All data presented in Fig. 1 are representative of at least three independent experiments.

