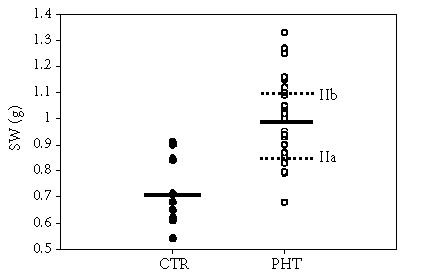
Figure 1.

Residual plot showing the distribution of spleen weights in all control and TSLP rats. The solid lines represent the mean values for the overall group. The broken lines represent the mean value for the TSLP rats with lower spleen weights (IIa) and the TSLP rats with higher spleen weights (IIb).
