

Abstract
Cell differentiation is regulated via expression of successive sets of genes. In an in vitro model of chondrocyte differentiation, human dermal fibroblasts (hDFs) cultured in collagen sponges are induced to express cartilage matrix genes after 7 days’ culture with demineralized bone powder (DBP). A shift in expression of many other genes occurs within 3 days, before chondroblast phenotypic genes are detectable. In this study, the pre-chondrogenic gene expression profile was used as a starting point to derive information on transcriptional regulation of chondrocyte differentiation induced by DBP. Putative cis regulatory elements were identified by comparing promoter regions from three genes that are highly upregulated in chondroinduced hDFs (BIGH3, COL1A2, and FN1) [Zhou, S., Glowacki, J., Yates, K.E, 2004. Comparison of TGF-β/BMP pathways signaled by demineralized bone powder and BMP-2 in human dermal fibroblasts. J. Bone Min. Res. 19, 1732-1741] and whose products are known to interact in the matrix [Kim, J.E., et al., 2002. Molecular properties of wild-type and mutant betaIG-H3 proteins. Investig. Ophthalmol. Vis. Sci. 43, 656-661]. The effect of DBP on nuclear protein binding to cis elements was measured with an array-based assay. Nuclear extracts from hDFs cultured in DBP/collagen sponges for 3 days showed increased binding to several cis elements belonging to the families that were identified by promoter analysis. Of note, those elements represented targets of both signal-activated and developmentally regulated transcription factors. Direct measurement of mRNAs showed increased gene expression of both types of transcription factors in chondroinduced hDFs, including NFKB2 (290% of control), RELA (160%), and GATA2 (190%). Moreover, DBP increased gene expression of chondrogenic transcription factors SOX9 (160% of control) and RUNX2 (180%). Immunoblot analysis showed that DBP increased both expression (200% of control) and phosphorylation (300%) of the Creb protein, a transcription factor that is downstream of several signal transduction pathways. Inhibition of protein kinase A, protein kinase C, or MAP kinase in hDFs cultured in DBP/collagen sponges reduced induction of BIGH3 to ∼50% of control. These results suggest that both signal-activated and developmentally controlled transcriptional mechanisms contribute to chondroinduction of hDFs by DBP.
Keywords: Demineralized bone, Chondrocyte differentiation, Transcriptional regulation
1. Introduction
Control of gene expression is a key mechanism to regulate cell fate and function. During embryonic development, chondrocyte differentiation is accomplished through integration of internal cues with signals from the surrounding cells and matrix (Shum and Nuckolls, 2002; Tuan, 2003). The first step in embryonic chondrogenesis, which is the condensation of mesenchymal cells into densely packed cellular aggregates, is regulated by cell-cell and cell-matrix interactions. The subsequent differentiation of mesenchymal cells into phenotypically distinct chondroblasts is coordinated by Sox family transcription factors (Akiyama et al., 2002; Bi et al., 1999; Smits et al., 2001; Zhao et al., 1997). RUNX2 is another transcription factor that regulates embryonic chondrocyte differentiation and maturation (de Crombrugghe et al., 2001; Smith et al., 2005; Stricker et al., 2002).
Less is known about the succession of events during postnatal chondrogenesis. An in vitro experimental system models the differentiation step of post-natal cells into chondroblasts (Mizuno and Glowacki, 1996a). In that system, human dermal fibroblasts (hDFs) are cultured with demineralized bone powder (DBP) that is constrained within a collagen sponge. Fibroblasts seeded on the sponge surface migrate throughout, contact the DBP and, after 7 days, are induced to express cartilage-specific matrix components such as Type II collagen and Aggrecan (Mizuno and Glowacki, 1996b). Analysis of differential gene expression in the DBP/collagen sponge system showed that induction of cartilage phenotypic genes is preceded by transient shifts in many other genes (Yates, 2004; Yates et al., 2001; Zhou et al., 2004). Three days after seeding onto sponges, hDFs cultured with DBP show altered expression of cytoskeletal and matrix components, peptide growth factors, and signal transduction proteins. The DBP-induced gene expression profile suggests that changes in cell shape and interactions with the matrix occur at early stages of chondroinduction in post-natal hDFs. Given that those cellular events are similar to the early stages in chondrocyte differentiation during embryonic development, and that DBP induces extensive changes in gene expression in hDFs by day 3, it is surprising that differential gene expression studies have identified very few transcription factors (although DBP does affect expression of transcriptional regulators that act at the chromatin level) (Yates et al., 2001; Zhou et al., 2004). Moreover, the transcription factors that have been identified (ID2, EGR-1)(Zhou et al., 2004) are not known to be major regulators of chondrogenesis.
In this study, gene expression data were used as a starting point to identify transcriptional regulators that contributed to the pre-chondrogenic mRNA profile. Because DBP affects the expression of more than 300 genes (Yates and Glowacki, 2003b; Yates et al., 2001; Zhou et al., 2004), a strategy was devised to identify factor(s) that coordinate DBP-altered gene expression. A group of proteins that are among the most highly upregulated by DBP-TGF-β-Induced/BIGH3 (BIGH3), Type I collagen (COL1A2), and Fibronectin (FN1)(Zhou et al., 2004)—are also known to interact in the matrix (Kim et al., 2002). Those observations suggest that expression of functional groups of genes might be coordinately regulated in hDFs exposed to DBP. Therefore, promoter sequences for BIGH3, COL1A2, and FN1 were scrutinized for cis regulatory elements common to those DBP-upregulated genes. Effects of DBP on specific elements were evaluated by DNA binding activity of nuclear proteins. That experimental approach was taken because constraints of the collagen sponge system limited the possibility of using reporter gene assays. First, full chondroinduction by DBP requires a three-dimensional environment; the collagen sponge culture device was employed in this study because it provides optimal geometry and packing density of DBP for interaction with target cells (Mizuno and Glowacki, 1996a). Second, hDFs have a limited lifespan in vitro. Because the cells must be cultured for at least 6 passages before seeding onto sponges (Mizuno and Glowacki, 1996b), it has not been possible to establish a stably transfected cell population (unpublished data). Therefore, DNA binding assays were used to evaluate effects of DBP on cis elements, and specific transcription factors were compared by measuring mRNA and protein levels.
2. Materials and methods
2.1. In silico promoter analysis
Commercially available software was used to obtain (Gene2Promoter; Genomatix GmBH, http://www.genomatix.de) and to compare (GEMS Launcher; Genomatix GmBH) promoter sequences for BIGH3 (GenBank accession No. NM_000358), FN1 (X02761), and COL1A2 (NM_000089).
2.2. Collagen sponge culture system for chondroinduction
Collagen sponges were prepared from bovine type I collagen (0.5% solution; Cellagen PC-5, ICN Biomedicals, Costa Mesa, CA) and rat demineralized bone powder as described (Mizuno and Glowacki, 1996a). In brief, for DBP/collagen sponges, a paper spacer was used to separate two layers of collagen solution (120-μl aliquots) in a custom sponge mold. The construct was lyophilized and irradiated with ultraviolet light. The paper was removed and a 3-mg portion of DBP was placed between the layers of collagen. Single-layer control collagen sponges were prepared with a 250-μl aliquot of collagen solution. The sponges were positioned in custom chambers and transferred to 12-well plates for cell seeding (Mizuno and Glowacki, 1996a).
Human dermal fibroblasts were isolated from neonatal foreskin explants and were cultured as described (Mizuno and Glowacki, 1996b). One million cells in 50 μl of culture medium (Dulbecco’s MEM, 10% fetal bovine serum, 100 U/ml penicillin, and 100 μg/ml streptomycin) were seeded onto the upper surface of each sponge. In some experiments, signal transduction inhibitors and agonists (Sigma, St. Louis, MO) were added to cultures 24 h after cells were seeded onto sponges.
For histology, cultured sponges were fixed in 0.1 M sodium cacodylate buffer containing 2% paraformaldehyde for 24 h. Plastic embedding, sectioning, and staining with Toluidine blue (pH 4.0) was as previously described (Yates et al., 2001).
2.3. Nuclear extracts
Nuclear proteins were extracted from hDFs with commercially available reagents (Nuclear Extract Kit; Active Motif, Carlsbad, CA). All steps were performed at 4 °C. Monolayer cultures of hDFs (10-cm2 dish) were processed according to the manufacturer’s recommendations. Because the collagen sponges contain 2-3×10⁶ cells on day 3 (Mizuno and Glowacki, 1996b), and the yield of nuclear extract from monolayer cultures was ∼ 6 μg/106 cells, it was anticipated that extracts could be prepared from individual sponges. Results from initial experiments, however, revealed that extracts from individual sponges were too dilute for downstream applications, despite the use of minimal buffer volumes. Therefore, DBP/collagen and control collagen sponges were processed in groups (4-16 sponges/group).
Nuclear extracts were prepared from hDFs cultured in collagen sponges by modifying the manufacturer’s protocol for intact tissues. Sponges were transferred into sterile, 50-ml conical tubes that contained ice-cold buffer (1× Hypotonic Lysis Buffer with 1 mM DTT and 0.1% Detergent; 0.5 ml/sponge) and were incubated on ice for 15 min prior to homogenization with a hand-held PowerGen fitted with a sterilized disposable generator (Fisher Scientific, Pittsburgh, PA). Fragments of the sponges, which were buoyant in the homogenization buffer, were removed by gravity flow through cell strainers (40 μm pore size). A second aliquot of homogenization buffer was used to rinse the generator tip and cell strainer. The filtrate was evaluated microscopically to verify that the nuclei were neither disrupted nor contaminated with DBP. The nuclei were centrifuged at 850×g, resuspended in 125 μl/sponge of 1× Hypotonic Lysis Buffer (Active Motif), and transferred to a sterile microcentrifuge tube. Detergent was added (6.25 μl/sponge; ActiveMotif) and the tubes were centrifuged for 30 s at 14,000×g. The pellets were resuspended in Complete Lysis Buffer (12.5 μl/sponge) and were incubated on a rocking platform for 40 min. The tubes were centrifuged for 10 min at 14,000×g. The supernatant was transferred to fresh tubes and frozen in aliquots at -80 °C.
Protein concentration was determined using a modified Bradford assay. A standard curve was prepared from bovine serum albumin in diluted Lysis Buffer (1:250). Nuclear extracts were diluted 1:50 in water. Duplicate wells containing 80 μlof sample and 20 μl of 1× Bradford dye reagent (Bio-Rad) were prepared in 96-well plates. Absorbance was measured at 595 nm and the protein concentration in the samples was extrapolated from the standard curve.
2.4. Array-based assay for DNA binding by nuclear proteins
Nuclear protein binding to consensus sequences for cis transcriptional elements was measured with commercially available kits (TranSignal Protein/DNA Arrays I and II; Panomics, Inc., Redwood City, CA). Aliquots of nuclear extract (10 μg) were incubated with a mixture of biotin-labeled oligonucleotides (TranSignal Probe Mix, Panomics) for 30 min at 15 °C. The reactions were electrophoresed through a 2% agarose gel and protein-bound probes were extracted with reagents provided by the manufacturer. The probes were hybridized to Arrays I and II; Array I is comprised of 54 features spotted in duplicate, with 1:10 dilutions spotted in the row beneath. On Array II, 96 features are spotted in duplicate. Hybridization, washing, and chemiluminescent detection were performed as directed (Panomics).
Data were extracted and analyzed per methods for cDNA arrays (Zhou et al., 2004). In brief, digital images were acquired from film exposures with a scanner fitted with a transparency adapter. Pixel intensity was measured with ScanAlyze 2.44 software (http://rana.lbl.gov/EisenSoftware.htm) after centering a grid over the array image (spot size = 18 × 20 pixels). Background was calculated as the mean pixel intensity of blank features on the array and was subtracted from each experimental feature. Only measurable values (i.e., pixel intensities within empirically determined background and saturation limits) were accepted for analysis. Multiple film exposures were used to obtain data within those limits. The mean pixel intensity for all features within the measurable range was used as a normalization factor between DBP/collagen and control collagen extracts. This approach was taken because the Protein/DNA array method had not been previously used with the collagen sponge experimental system and a reference transcription factor had not yet been validated. The normalization factor was close to 1 for all film exposures of Array I, and was ∼ 1.7 for both exposures of Array II (Table 1).
Table 1.
Normalization factors calculated from the ratio of mean pixel intensity for all features (DBP/COL) on protein/DNA arrays
| Length of exposure | DBP/COL | |
|---|---|---|
| Array I | 15 s | 1.1 |
| 1 min | 1.0 | |
| 5 min | 1.1 | |
| 25 min | 1.1 | |
| Array II | 10 s | 1.7 |
| 1 min | 1.6 |
2.5. RNA isolation
Total RNA was prepared by homogenizing sponges in Trizol reagent (Invitrogen, Carlsbad CA; 1 ml/sponge). Groups of sponges were homogenized in 50-ml conical tubes with a rotor-stator fitted with an RNAse-free 7-mm generator (Fisher) (Yates et al., 2001). Individual sponges were homogenized in 1.5-ml microcentrifuge tubes with a motorized pellet pestle fitted with RNAse-free, disposable pestles (Kimble/Kontes, Vineland, NJ). RNA quality was evaluated by electrophoresis on formaldehyde-agarose gels.
2.6. Measurement of transcription factor mRNAs by cDNA array
Aliquots of total RNA from groups of DBP/collagen and control collagen sponges (4 sponges/group) were used to synthesize probes for the TranSignal Human TF cDNA Array (Panomics, Inc). Hybridization, washing, and detection were carried out per the manufacturer’s instructions. Data were acquired from digitized film exposures with ScanAlyze software (grid spot size of 20 × 17 pixels) and curated as described (Zhou et al., 2004). The data were background-subtracted and normalized to a validated reference gene, GAPDH (Yates and Glowacki, 2003a).
2.7. Measurement of transcription factor mRNAs by real-time PCR
PCR primer sequences were obtained from publicly available databases for SOX9 (PrimerBank ID #4557853a2; http://pga.mgh.harvard.edu/primerbank/index.html)(Wang and Seed, 2003) and ID2 (RTPrimerDB ID# 102; http://medgen. UGent.be/rtprimerdb/)(Pattyn et al., 2006). Published primers were used for RUNX2 (Frank et al., 2002) and the reference genes GAPDH, HPRT, and UBC (Vandesompele et al., 2002). All primer pairs were tested in PCRs with cDNA prepared from hDFs cultured in monolayers. Each pair gave a single product of the expected size, which was subcloned (TOPO cloning kit, Invitrogen) and sequenced. Those plasmids were used to prepare standard curves for quantification by real-time PCR.
Aliquots of total RNA from groups of sponges (10 sponges/group in Experiment 1; 12 sponges/group in Experiments 2 and 3) were treated with DNase I (Invitrogen) prior to cDNA synthesis with iQ Supermix (Bio-Rad, Hercules, CA). Aliquots of cDNAs (equivalent to 100 ng total RNA) were used in quadruplicate 50-μl PCRs with iQ SYBR Green Supermix (Bio-Rad). Standard curves for copy number calculations and melting curves were run in each experiment. For each independent experiment, a normalization factor was obtained from the geometric mean of three reference genes, GAPDH, HPRT, and UBC (Vandesompele et al., 2002) and was used to calculate the expression level for genes of interest.
2.8. Electrophoretic mobility shift assay (EMSA)
Mobility shift assays were performed with commercially available kits (ActiveMotif). Oligonucleotide probes were labeled with [32P]-ATP (3000 Ci/mmol, 10 mCi/ml; Perkin-Elmer) in a kinase reaction (T4 Polynucleotide kinase; Invitrogen). Nuclear extracts were diluted in buffer provided by the manufacturer and were incubated with labeled probes. Excess oligonucleotide was added to the reactions as either specific competitor (unlabeled probe) or non-specific competitor (mutant oligonucleotide). Protein/DNA complexes were subjected to electrophoresis through 6% polyacrylamide gels in 0.5× TBE buffer (Invitrogen). Autoradiographs obtained from air-dried gels were digitized, and the shifted complexes were measured by pixel density with Scion Image software (Scion Corporation, Frederick, MD).
2.9. Immunoassay for AP-1 components
The abundance of Jun family proteins in AP-1 complexes was measured by an ELISA-based immunoassay (TransAM kit; ActiveMotif). Nuclear extracts were diluted in buffer and were added to 96-well plates (1 μg protein/well) pre-coated with oligonucleotides encoding an AP-1 response element. Standard curves were prepared with control nuclear extract provided by the manufacturer. Incubation with antibodies, washing, and detection with horseradish peroxidase-conjugated secondary antibody were performed according to the manufacturer’s instructions. Absorbance of the substrate was measured at 450 nm on a plate reader.
2.10. Immunoblot
Nuclear extracts were subjected to electrophoresis (5 μg protein/lane) through NuPAGE Bis-Tris Gels (Invitrogen) and electroblotted onto positively charged nylon membranes (Roche Molecular Biochemicals, USA). The blots were blocked and incubated with primary antibodies that recognize histone H4, Creb, or phospho-Creb as directed by the supplier (Upstate Biotechnologies, Lake Placid, NY). Immune complexes were visualized by enhanced chemiluminescence (Amersham Biosciences, Piscataway, NJ). Digital images of film exposures were analyzed with Scion Image software. Protein expression levels of Creb and phospho-Creb were measured from pixel density and were normalized to histone H4.
2.11. Measurement of DBP target gene mRNA by Northern hybridization
Northern blots were prepared by downward capillary transfer onto nylon membranes, as described (Yates et al., 2001). The blots were stained with 0.3% methylene blue to visualize the transferred RNAs and were photographed. DNA probes for BIGH3 (Zhou et al., 2004) and GAPDH (Yates and Glowacki, 2003a) were generated by PCR and were labeled with [32P]-dCTP (Random Primed DNA Labeling Kit, Roche Molecular Biochemicals, USA). Autoradiographs and photographs were scanned and analyzed with Scion Image software to measure gene expression levels.
3. Results and discussion
3.1. Identification of cis transcriptional elements in fibroblasts chondroinduced with demineralized bone
In an in silico analysis, 13 classes of cis regulatory elements were found that were common to the BIGH3, FN1, and COL1A2 promoters: cAMP response (CRE); Epstein-Barr virus; early growth response (EGR); signal transducer and activator of transcription (STAT); paired box gene 5 (PAX5); p53; serum response element; E-box; Myc-associated zinc fingers; Krueppel-like factor; RAR-related orphan receptors; zinc binding protein factor; and homeodomain proteins.
The effect of DBP on those elements was assessed by measuring nuclear protein binding to consensus sequences. Nuclear extracts were prepared from hDFs cultured in DBP/collagen and control collagen sponges for 3 days, so that the information obtained on protein interactions with cis elements would be synchronous with the previously characterized pre-chondrogenic gene expression profile. One sponge from each group was evaluated by histology (Fig. 1) to confirm that hDFs had attached to DBP but were otherwise similar in appearance to cells cultured in control collagen sponges, as expected (Yates et al., 2001). The yield of nuclear protein extracted from hDFs cultured in DBP/collagen sponges (12.5 ± 1.6 μg/sponge) was not statistically different from hDFs cultured in control collagen sponges (12.9 ± 5.2 μg/sponge; n = 3 experiments). Moreover, those quantities were consistent with the yield from similar numbers of hDFs cultured in monolayers. Cellularity in DBP/collagen and control collagen sponges is equivalent on day 3 (Mizuno and Glowacki, 1996b). Therefore, complete extraction of nuclear proteins was achieved from hDFs cultured in collagen sponges, and was not affected by DBP.
Fig. 1.
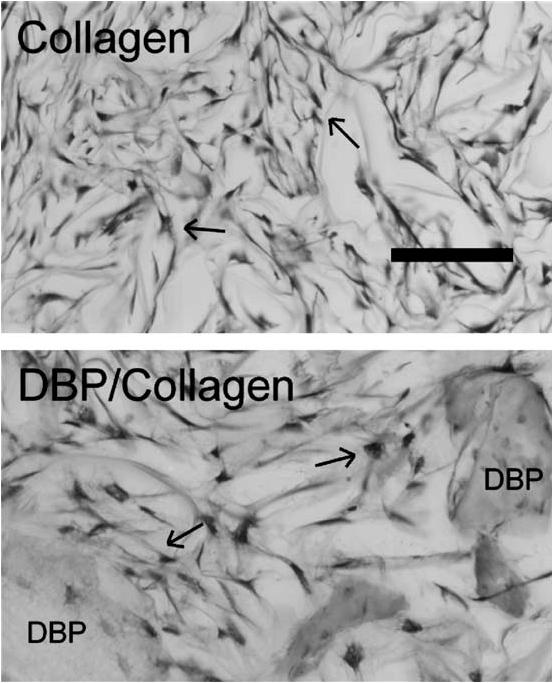
Toluidine blue-stained sections (20 μm) of hDFs cultured in control collagen and DBP/collagen sponges for 3 days. The cells are darkly stained (arrows) and particles of demineralized bone are indicated (DBP). Bar = 100 μm.
Nuclear proteins bound to cis elements in extracts from DBP/collagen sponges were compared to control sponges. An array-based assay was used to maximize the number of elements that could be evaluated (Fig. 2). Because this was the first time that a DNA binding assay had been attempted with the collagen sponge culture system, a group of elements was selected for validation. The effects of DBP on gene expression in hDFs suggest that adipogenic potential is diminished during chondroinduction (Zhou et al., 2004). Therefore, a group of cis elements that regulate adipogenesis were selected as the test set. Overall, the observed effects of DBP on nuclear protein binding to adipogenic elements were consistent with expectations for chondroinduced hDFs. Binding to consensus sequences for PPARα and γ was below the lower limit of detection in nuclear extract from control hDFs, and was not increased by exposure to DBP. A moderate amount of binding to C/EBPα was decreased by exposure to DBP (30% of control). Nuclear protein binding to cis elements involved in fatty acid biosynthesis (Schweizer et al., 2002) was either decreased by DBP (70% of control for upstream stimulatory factor, USF) or was below the limit of detection (sterol regulatory element). Those observed decreases or undetectable levels of activity for the adipogenic elements were in agreement with the gene expression data (Zhou et al., 2004). To further validate the protein binding assay, measurements were compared for HNF4, a cis element represented on both of the protein/DNA arrays. Nuclear protein binding to HNF4 in extracts from DBP/collagen sponges was similar to control collagen extracts (110% of control on Array I, and 120% of control on Array II). From these results it can be concluded that the nuclear extracts from DBP/collagen and control collagen sponges were of similar quality, and that the observed changes with adipogenic test set elements reflect actual decreases in nuclear protein binding in DBP/collagen extracts.
Fig. 2.
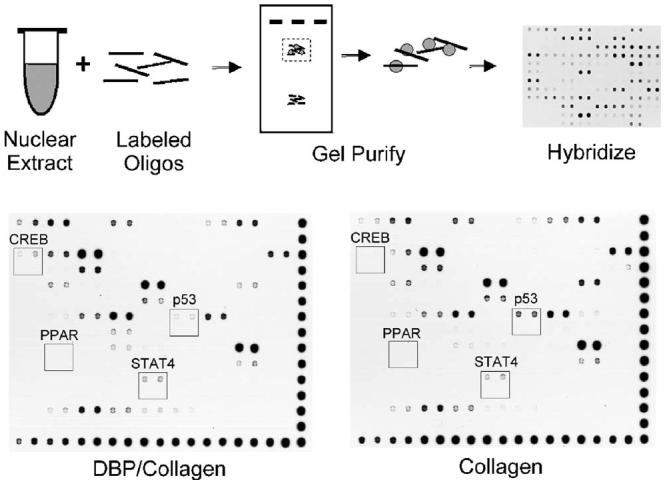
Overview of array-based assay to measure nuclear proteins bound to cis elements. Nuclear proteins extracted from human dermal fibroblasts cultured in DBP/collagen or control collagen sponges are incubated with labeled oligonucleotides that encode consensus sequences for transcriptional regulatory elements. Protein-DNA complexes are purified and hybridized to nylon membranes arrayed with complementary oligonucleotides. Representative images are shown for Protein/DNA Array I (5 min film exposure). Biotinylated DNA is spotted along the bottom and right edges of the arrays. Rows contain cis element sequences spotted in duplicate; 1:10 dilutions of the same sequences are spotted in duplicate in the following row. Specific examples of array results are indicated by boxes: no activity detected in either DBP/collagen or control nuclear extracts (PPAR); moderately increased protein binding activity in DBP/collagen extract (STAT4); greatly increased activity in DBP/collagen extract (CREB); and decreased activity in DBP/collagen extract (p53). (Measurements for CREB were not made from this image because the pixel intensity in the control collagen sample was below the lower limit for analysis.)
After the array-based assay was validated, protein binding was compared for cis regulatory elements identified in the promoter analysis. Six out of 7 of the families of cis elements that were represented on the array were affected by DBP (Table 2). Nuclear protein binding was increased in DBP/collagen sponges at most of the consensus sequences, except for PAX5 and p53.
Table 2.
Measurement of nuclear protein binding to putative cis regulatory elements common to the BIGH3, FN1, and COL1A2 promoters
| Family | Description | Consensus element | Activitya | % of control |
|---|---|---|---|---|
| CREB | cAMP-Responsive element binding proteins | CREB1 | +++ | 1070 |
| E4BP4 | +++ | 220 | ||
| ATF | +++ | 180 | ||
| REBV | Epstein—Barr virus transcription factor R | ZIC | +++ | 650 |
| ZIA | + | 360 | ||
| EGR | EGR/nerve growth factor induced protein C and related factors | EGR | +++ | 200 |
| STAT | Signal transducer and activator of transcription | STAT4 | ++ | 140 |
| PAX5 | PAX-5/PAX-9 B-cell-specific activating protein | PAX5 | +++ | 30 |
| P53 | p53 tumor suppressor | TP53 | ++ | 20 |
The amount of protein binding measured in nuclear extract prepared from hDFs cultured in DBP/collagen sponges is expressed as a percent of the control collagen extract.
Amount of protein bound to cis element from control hDFs extracts, assessed by the film exposure used for quantitation: 10 or 15 s (+++), 1 or 5 min (++), 25 min (+).
3.2. Classification of transcriptional regulators affected by DBP
Recently, Brivanlou and Darnell (2002) proposed a classification to distinguish transcription factors whose activity is regulated by upstream signaling events from those subject to developmental control. Consideration of the cis elements identified by the promoter analysis in this study suggested that both types of transcriptional mechanisms contribute to the pre-chondroblastic gene expression profile induced by DBP. Data from the DNA binding array assay were scrutinized to identify other regulatory elements potentially affected by DBP.
Increased protein binding in DBP/collagen extracts was found for several cis elements that are targets of signal-activated transcription factors: AP-1 (510% of control), AP-2 (440%), NFKB2 (290%), REL (160%), NF-E2 (150%), and E2F-1 (150%). A cDNA array was used to measure gene expression of some of the transcription factors known to bind those cis elements. Human DFs cultured in DBP/collagen sponges showed increased mRNA expression for NFKB2 (290% of control) and RELA (160%), and E2F1 (250%). DBP was previously found to increase expression of the EGR-1 mRNA (Zhou et al., 2004). Therefore, the effect of DBP on gene expression of signal-activated transcription factors was generally in concordance with the observed increases in nuclear protein bound to their target cis elements.
Additional cis elements that are targets of developmentally regulated factors included Forkhead, GATA, and homeobox proteins (Table 3). Those developmentally regulated factors are not known to play major roles during embryonic chondrogenesis. Therefore, mRNA levels were measured for SOX9, the chondrogenic master gene (Akiyama et al., 2002; Bi et al., 1999), and RUNX2, which regulates chondrocyte differentiation and maturation during skeletal development (de Crombrugghe et al., 2001; Smith et al., 2005; Stricker et al., 2002).
Table 3.
Measurement of nuclear proteins from human dermal fibroblasts cultured in DBP/collagen sponges bound to putative cis regulatory elements for developmentally regulated transcription factors
| Family | Factor | Activity a | % of control | Family | Factor | Activity a | % of control |
|---|---|---|---|---|---|---|---|
| Forkhead | FOXO1A | ++ | 60 | GATA | GATA-1 | ++ | 60 |
| FOX04 | ++ | 130 | GATA-2 | ++ | 240 | ||
| FOXF2 | ++ | 180 | GATA-4 | +++ | 70 | ||
| FOXD1 | ++ | 200 | GATA-5 | + | 420 | ||
| FOXL1 | ++ | 230 | Paired box | PAX3 | +++ | 150 | |
| HFH-3 | ++ | 290 | PAX4 | ++ | 130 | ||
| Homeobox | Pbx1 | + | 10 | PAX6 | ++ | 180 |
Activity level in control hDFs assessed by the film exposure used for quantitation: 10 or 15 s (+++), 1 or 5 min (++), 25 min (+).
Real-time PCR was used to compare mRNA expression levels in DBP/collagen and control collagen sponges on day 3 (Fig. 3). Both SOX9 (160% ± 10 of control) and RUNX2 (180% ± 30) mRNAs were increased in hDFs after exposure to DBP. As a control, mRNA levels were also measured for ID2,a transcription factor whose expression is increased by DBP (Zhou et al., 2004). As expected, exposure to DBP increased ID2 in hDFs (170% ± 70 of control). Of note, ID2 was the most abundant of the three transcription factors, with mRNA levels approximately 10-fold greater than RUNX2, and 1000-fold greater than SOX9 (Fig. 3). Those very low expression levels may have precluded detection of increased expression by DBP in previous studies. Consistent with the results reported here, ectopically expressed SOX9 has been shown to induce the chondrocyte phenotype in post-natal hDFs cultured in three-dimensional spheroids (Ikeda et al., 2004). Overall, these results suggest that developmentally regulated mechanisms of transcription contribute to chondroinduction of hDFs by DBP.
Fig. 3.
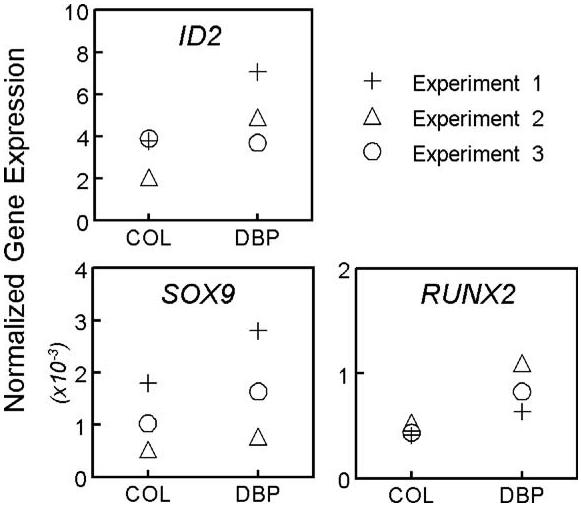
Measurement of chondrogenic transcription factor mRNAs in hDFs cultured in control collagen (COL) or DBP/collagen (DBP) sponges for 3 days. Copy numbers of mRNA transcripts were measured by real-time PCR and are expressed as a ratio with the normalization factor (calculated from 3 reference genes). ID2 was used as a control gene that is increased by DBP.
3.3. Complexity of DBP effects on transcription factor binding to cis elements
Transcription factors in the Jun family bind to AP-1 elements as homodimers or as heterodimers with Fos family proteins (Hess et al., 2004). In addition to Fos proteins, Jun proteins can dimerize with transcription factors from other families such as Creb/ATF (Hai and Curran, 1991). That type of cross-family interaction, as well as the potential for cross-element binding (i.e., AP-1 components binding to cAMP response elements) (Muchardt et al., 1990) creates considerable complexity in cis and trans element interactions. The large increase (∼500% of control) that was observed in this study for nuclear protein binding to an AP-1 element was surprising, because AP-1 activity is unchanged during chondrogenic differentiation of C3H10T1/2 embryonic mesenchymal cells (Seghatoleslami and Tuan, 2002) and has a negative impact on maturation of chick chondrocytes (Kameda et al., 1997). Therefore, the effect of DBP on AP-1 was investigated further.
The abundance of AP-1 complexes was evaluated by an electrophoretic mobility shift assay (EMSA). Control assays with nuclear extract from hDFs cultured in monolayers showed a single DNA/protein complex that was shifted by an AP-1 probe (Fig. 4A). Specificity of that AP-1 complex was demonstrated by adding an excess of unlabeled competitor probe; addition of unlabeled mutant probe did not affect the shifted complex (Fig. 4A). The abundance of the AP-1 complex decreased linearly with the quantity of nuclear extract (Fig. 4B).
Fig. 4.
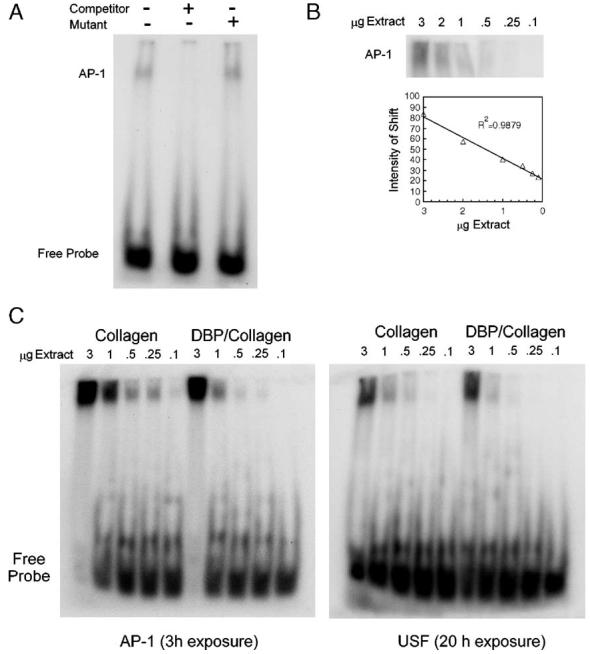
Measurement of protein-DNA complexes by electrophoretic mobility shift assay. (A) A single complex is shifted by a labeled AP-1 probe in nuclear extract from hDFs cultured in monolayer (3 μg/lane). The AP-1 complex is reduced by addition of an unlabeled, competitor oligonucleotide, but not an unlabeled mutant oligonucleotide. (B) The amount of AP-1 complex is proportional to the quantity of nuclear extract in the reaction. (C) AP-1 and USF complexes are more abundant in nuclear extract from control collagen sponges than in DBP/collagen extract.
AP-1 complexes were highly abundant in hDFs cultured in sponges, with sufficient activity in 3 μg of either DBP/collagen or control collagen extract to saturate the probe (Fig. 4C). Reactions that contained sub-saturating quantities of extract, however, revealed that AP-1 complexes were less abundant in DBP/collagen sponges than in control collagen sponges (∼ 40% of control at 1 μg extract) (Fig. 4C). That result was in contrast to the increased AP-1 observed with the array-based assay. To determine whether the EMSA result was due to an overall difference between the two methods, a control EMSA was performed with a probe for USF. That probe shifted a single complex that was less abundant than the AP-1 complexes (Fig. 4C). The amount of USF complexes in DBP/collagen extracts was ∼50% of control collagen extracts. That magnitude was close to the measurement obtained from the array assay (70% of control, suggesting that the EMSA result for AP-1 was specific and not due to inherent differences in the technique.
Because AP-1 elements are primarily bound by transcription factors in the Jun family, the abundance of c-Jun, JunB, and JunD in AP-1 complexes was measured by immunoassay. Standard curves verified the linearity of response to the quantity of nuclear extract, and all three Jun family proteins were detected in extracts from both control and DBP/collagen sponges (Fig. 5). The relative amounts of c-Jun and JunD, however, were lower in DBP/collagen sponges. Those results supported the EMSA data that showed decreased AP-1 in hDFs exposed to DBP.
Fig. 5.
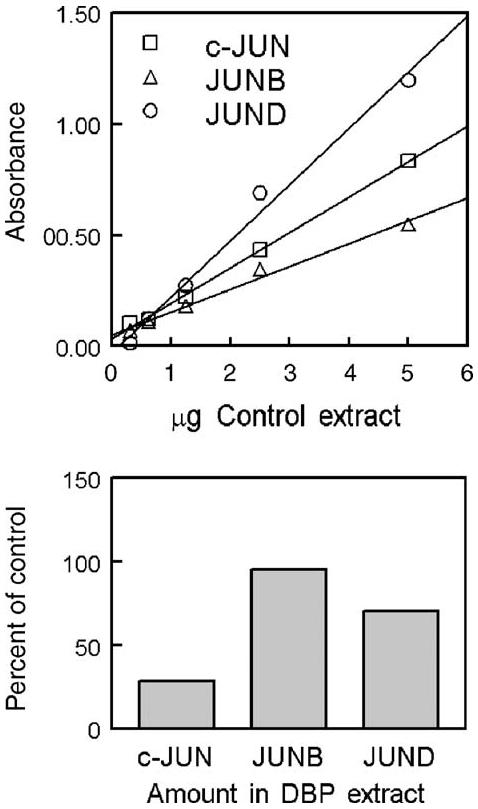
Immunoassay to measure Jun family proteins. The measured amount of c-Jun, JunB, and JunD in AP-1 complexes is proportional to the quantity of control nuclear extract. Jun family proteins in complexes bound to an AP-1 element were measured in DBP/collagen sponge extract (percent of control collagen extract).
A possible explanation for the contrasting results from the array-based assay and the EMSA and immunoassays concerns the DNA sequences of the AP-1 probes. The array probe sequence, TGACTCA, encodes a consensus phorbol ester (12-O-tetradecanoylphorbol-13-acetate, or PMA)-responsive AP-1 element (Lee et al., 1987). The EMSA and immunoassay probes also encode a consensus PMA-response element, but their sequence differs from the array probe by a single base pair (TGAGTCA). Both Creb (Masquilier and Sassone-Corsi, 1992) and the Creb family protein, ATF3 (Hai and Curran, 1991) can bind to the TGACTCA sequence. The EMSA and immunoassay data suggest that the AP-1 activity detected in the array may, in fact, be due to cross-element binding. These results underscore the importance of confirming data through gene expression or other assays for specific factors.
3.4. Upstream signaling events are needed for full induction of the DBP target gene, BIGH3
The Creb transcription factor regulates embryonic chondrogenesis in the chick (Lee and Chuong, 1997; Zakany et al., 2002) and mouse (Long et al., 2001). Results of the DNA binding array assay showed a large increase in nuclear protein from DBP/collagen extracts that bound to a cAMP response element, suggesting that Creb may also be involved in postnatal chondrogenesis. Upstream signaling events trigger phosphorylation of Creb on serine 133, which activates that transcription factor (Parker et al., 1996). Therefore, Creb phosphorylation was evaluated to determine whether exposure to DBP activates upstream signaling pathways in hDFs.
Human DFs cultured in monolayers were used to verify that Creb phosphorylation was not labile in nuclear extracts and could be detected by immunoblot (Fig. 6A). Nuclear extracts from hDFs control collagen sponges showed that phospho-Creb levels were equal to total Creb protein on day 3 (Fig. 6B). That result was suggestive of a basal level of signaling activity in the collagen sponge through pathways that target Creb. Extracts from DBP/collagen sponges showed an increase in both total Creb (200% of the amount in control collagen sponges) and phospho-Creb (300% of control). The increased expression and activation of Creb was consistent with the nuclear protein binding data (Table 2). Therefore, the data suggested that exposure to DBP increased signaling activity through pathways that converge on Creb.
Fig. 6.
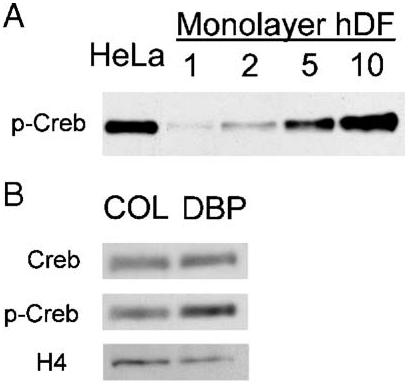
Immunoblot analysis of total and activated Creb in nuclear extracts. (A) Detection of phosphorylated Creb in increasing amounts of nuclear extract (1-10 μg/lane) from hDFs cultured in monolayer. Nuclear extract from HeLa cells is included as a positive control for the antibody. (B) Comparison of total Creb and activated, phosphorylated Creb (p-Creb) in nuclear extracts from hDFs cultured in DBP/collagen (DBP) or control collagen sponges (COL) for 3 days (5 μg protein/lane).
To determine whether upstream signaling events triggered by DBP were linked to induction of pre-chondrogenic genes in hDFs, the effect of DBP on BIGH3 expression was measured under conditions that inhibit signaling. Protein kinase A (PKA), MAP kinase, and protein kinase C (PKC) were selected for inhibition because Creb is known to be a downstream target in those pathways (Shaywitz and Greenberg, 1999). Kinetics of DBP-induced gene expression were characterized to determine an appropriate time for addition of inhibitors, and GAPDH, which has been validated as a reference gene for hDFs cultured in sponges for 3 days (Yates and Glowacki, 2003a), was evaluated at shorter culture intervals by comparison with 28S RNA (Fig. 7). As previously reported (Yates and Glowacki, 2003a), GAPDH expression in DBP/collagen sponges was nearly equivalent to control collagen sponges at 72 h (86% of control). At earlier timepoints, however, GAPDH mRNA was less abundant in DBP/collagen sponges (43% of control at 24 h, and 65% at 48 h) (Fig. 7). Subsequently, 28S RNA was used as a reference RNA to measure gene expression levels at early timepoints, and GAPDH was used as a control gene.
Fig. 7.
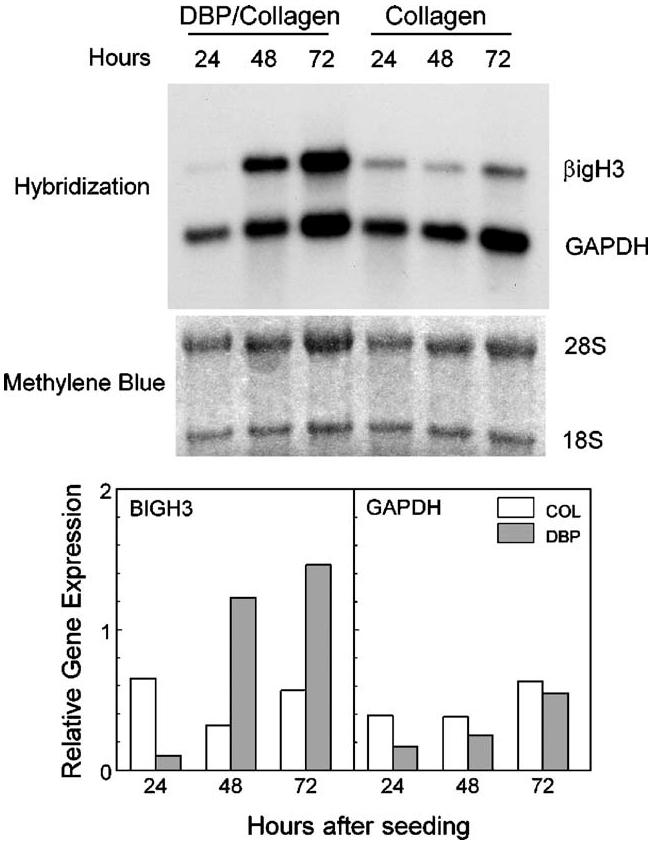
Induction of BIGH3 mRNA in human dermal fibroblasts cultured with DBP. Total RNA was extracted from individual sponges at 24-h intervals. The Northern blot (3.5 μg RNA/lane) was hybridized to probes for BIGH3 and GAPDH. Ribosomal RNAs (28S and 18S) were visualized by staining the membrane with methylene blue. Expression levels of mRNA transcripts were normalized to 28S RNA.
BIGH3 mRNA levels in DBP/collagen sponges increased 10-fold between 24 and 48 h, and remained elevated at 72 h (Fig. 7). In contrast, BIGH3 was not elevated in control sponges cultured up to 72 h. As expected, BIGH3 expression was greater in the DBP/collagen sponges at 72 h than in collagen sponges (260% of control). Those results suggested that 24 h was an appropriate time to add signal transduction inhibitors to sponge cultures—after the cells had contacted DBP, but before BIGH3 mRNA expression levels increased.
In a second experiment, BIGH3 mRNA levels were again increased in DBP/collagen sponges (∼200% of control) and GAPDH was equivalent (100% of control) after 72 h of culture. Inhibitors of protein kinase A (H89), MAP kinase (PD-98,059), and protein kinase C (PMA) reduced BIGH3 mRNA levels in DBP/collagen sponges to ∼50% of the amount in untreated sponges (Fig. 8). In control collagen sponges, all three signaling inhibitors also reduced BIGH3 mRNA levels. Although H89 decreased GAPDH expression in DBP/collagen sponges, the majority of samples did not show reduced GAPDH expression in the presence of inhibitors.
Fig. 8.
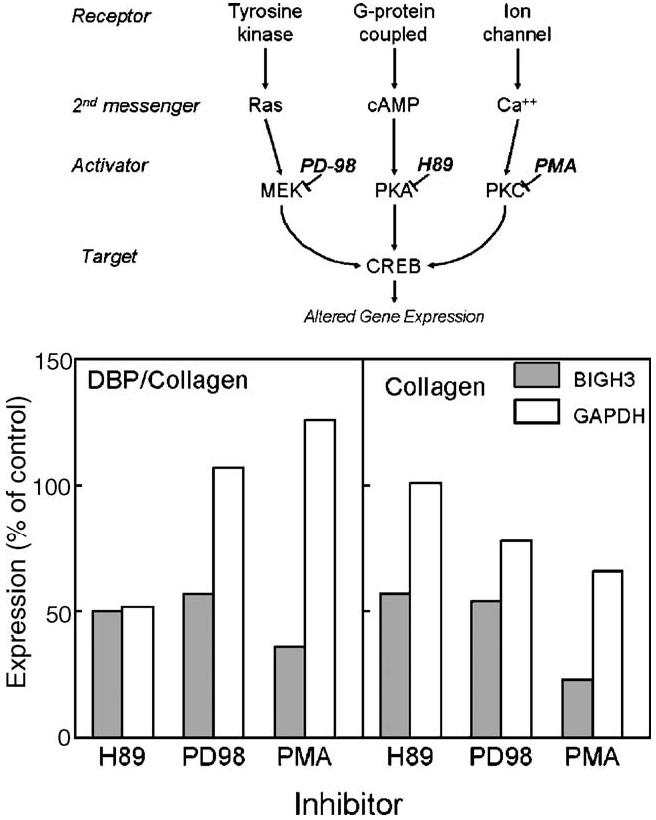
Effect of signal transduction inhibitors on gene expression in collagen sponges. Inhibitors of protein kinase A (20 mM H89), MAP kinase (50 μM PD-98,059) or protein kinase C (10 nM PMA) were added to sponge cultures 24 h after cell seeding. Total RNA was extracted from individual sponges after an additional 48 h of culture. BIGH3 and GAPDH mRNA expression levels were normalized to 28S RNA and expressed as a percent of the measured amount in untreated control sponges.
These results show that inhibiting signal transduction reduced the extent of BIGH3 up-regulation by DBP. Decreased BIGH3 in control collagen sponges suggests that the DBP-mediated increase of that mRNA occurs through amplified signaling activity, rather than de novo stimulation. That hypothesis is consistent with the overall changes in gene expression induced by DBP, in which target genes show altered expression, but are not completely induced or repressed (Yates and Glowacki, 2003b; Yates et al., 2001; Zhou et al., 2004).
4. Conclusion
In this study, the gene expression profile of a pre-chondroblastic cell was used to identify transcriptional regulators that contribute to induced differentiation of postnatal fibroblasts. The collective evidence from this study and other work with the collagen sponge system (Yates, 2004; Yates and Glowacki, 2003a; Yates et al., 2001; Zhou et al., 2004) suggests that chondroinduction by DBP is accomplished through extracellular signals (matrix components and soluble peptide factors), cell shape changes, and developmentally regulated transcriptional networks. Conceptually, those mechanisms resemble key events in embryonic chondrogenesis; nevertheless it appears that there are specific aspects of transcriptional regulation that differ in post-natal chondroinduction.
Acknowledgements
I am grateful to Kara Johnson for assistance in preparing collagen sponges. This work was supported by NIH grant # DE15343.
Footnotes
- cAMP
- cyclic adenosine 3′,5′-monophosphate
- cDNA
- DNA complementary to RNA
- DBP
- demineralized bone powder
- DNAse
- deoxyribonuclease
- EMSA
- electrophoretic mobility shift assay
- hDF
- human dermal fibroblast
- PCR
- polymerase chain reaction
- rRNA
- ribosomal RNA.
References
- Akiyama H, Chaboissier MC, Martin JF, Schedl A, de Crombrugghe B. The transcription factor SOX9 has essential roles in successive steps of the chondrocyte differentiation pathway and is required for expression of Sox5 and Sox6. Genes Dev. 2002;16:2813–2828. doi: 10.1101/gad.1017802. [DOI] [PMC free article] [PubMed] [Google Scholar]
- Bi W, Deng JM, Zhang Z, Behringer RR, de Crombrugghe B. SOX9 is required for cartilage formation. Nat. Genet. 1999;22:85–89. doi: 10.1038/8792. [DOI] [PubMed] [Google Scholar]
- Brivanlou AH, Darnell Jr. JE. Signal transduction and the control of gene expression. Science. 2002;295:813–818. doi: 10.1126/science.1066355. [DOI] [PubMed] [Google Scholar]
- de Crombrugghe B, Lefebvre V, Nakashima K. Regulatory mechanisms in the pathways of cartilage and bone formation. Curr. Opin. Cell Biol. 2001;13:721–727. doi: 10.1016/s0955-0674(00)00276-3. [DOI] [PubMed] [Google Scholar]
- Frank O, et al. Real-time quantitative RT-PCR analysis of human bone marrow stromal cells during osteogenic differentiation in vitro. J. Cell. Biochem. 2002;85:737–746. doi: 10.1002/jcb.10174. [DOI] [PubMed] [Google Scholar]
- Hai T, Curran T. Cross-family dimerization of transcription factors Fos/Jun and ATF/CREB alters DNA binding specificity. Proc. Natl. Acad. Sci. U. S. A. 1991;88:3720–3724. doi: 10.1073/pnas.88.9.3720. [DOI] [PMC free article] [PubMed] [Google Scholar]
- Hess J, Angel P, Schorpp-Kistner M. AP-1 subunits: quarrel and harmony among siblings. J. Cell. Sci. 2004;117:5965–5973. doi: 10.1242/jcs.01589. [DOI] [PubMed] [Google Scholar]
- Ikeda T, et al. The combination of SOX5, SO X6, and SOX9 (the SOX trio) provides signals sufficient for induction of permanent cartilage. Arthritis Rheum. 2004;50:3561–3573. doi: 10.1002/art.20611. [DOI] [PubMed] [Google Scholar]
- Kameda T, Watanabe H, Iba H. C-Jun and JunD suppress maturation of chondrocytes. Cell Growth Differ. 1997;8:495–503. [PubMed] [Google Scholar]
- Kim JE, et al. Molecular properties of wild-type and mutant betaIG-H3 proteins. Investig. Ophthalmol. Vis. Sci. 2002;43:656–661. [PubMed] [Google Scholar]
- Lee YS, Chuong CM. Activation of protein kinase A is a pivotal step involved in both BMP-2- and cyclic AMP-induced chondrogenesis. J. Cell. Physiol. 1997;170:153–165. doi: 10.1002/(SICI)1097-4652(199702)170:2<153::AID-JCP7>3.0.CO;2-N. [DOI] [PubMed] [Google Scholar]
- Lee W, Mitchell P, Tjian R. Purified transcription factor AP-1 interacts with TPA-inducible enhancer elements. Cell. 1987;49:741–752. doi: 10.1016/0092-8674(87)90612-x. [DOI] [PubMed] [Google Scholar]
- Long F, Schipani E, Asahara H, Kronenberg H, Montminy M. The CREB family of activators is required for endochondral bone development. Development. 2001;128:541–550. doi: 10.1242/dev.128.4.541. [DOI] [PubMed] [Google Scholar]
- Masquilier D, Sassone-Corsi P. Transcriptional cross-talk: nuclear factors CREM and CREB bind to AP-1 sites and inhibit activation by Jun. J. Biol. Chem. 1992;267:22460–22466. [PubMed] [Google Scholar]
- Mizuno S, Glowacki J. Three-dimensional composite of demineralized bone powder and collagen for in vitro analysis of chondroinduction of human dermal fibroblasts. Biomaterials. 1996a;17:1819–1825. doi: 10.1016/0142-9612(96)00041-5. [DOI] [PubMed] [Google Scholar]
- Mizuno S, Glowacki J. Chondroinduction of human dermal fibroblasts by demineralized bone in three-dimensional culture. p. Cell Res. 1996b;227:89–97. doi: 10.1006/excr.1996.0253. [DOI] [PubMed] [Google Scholar]
- Muchardt C, Li C, Kornuc M, Gaynor R. CREB regulation of cellular cyclic AMP-responsive and adenovirus early promoters. Virol. 1990;64:4296–4305. doi: 10.1128/jvi.64.9.4296-4305.1990. [DOI] [PMC free article] [PubMed] [Google Scholar]
- Parker D, et al. Phosphorylation of CREB at Ser-133 induces complex formation with CREB-binding protein via a direct mechanism. l. Cell. Biol. 1996;16:694–703. doi: 10.1128/mcb.16.2.694. [DOI] [PMC free article] [PubMed] [Google Scholar]
- Pattyn F, Robbrecht P, De Paepe A, Speleman F, Vandesompele J. RTPrimerDB: the real-time PCR primer and probe database, major update 2006. cleic Acids Res. 2006;34:D684–D688. doi: 10.1093/nar/gkj155. [DOI] [PMC free article] [PubMed] [Google Scholar]
- Schweizer M, Roder K, Zhang L, Wolf SS. Transcription factors acting on the promoter of the rat fatty acid synthase gene. ochem. Soc. Trans. 2002;30:1070–1072. doi: 10.1042/bst0301070. [DOI] [PubMed] [Google Scholar]
- Seghatoleslami MR, Tuan RS. Cell density dependent regulation of AP-1 activity is important for chondrogenic differentiation of C3H10T1/2 mesenchymal cells. J. Cell. Biochem. 2002;84:237–248. doi: 10.1002/jcb.10019. [DOI] [PubMed] [Google Scholar]
- Shaywitz AJ, Greenberg ME. CREB: a stimulus-induced transcription factor activated by a diverse array of extracellular signals. Annu. Rev. Biochem. 1999;68:821–861. doi: 10.1146/annurev.biochem.68.1.821. [DOI] [PubMed] [Google Scholar]
- Shum L, Nuckolls G. The life cycle of chondrocytes in the developing skeleton. Arthritis Res. 2002;4:94–106. doi: 10.1186/ar396. [DOI] [PMC free article] [PubMed] [Google Scholar]
- Smith N, et al. Overlapping expression of Runx1(Cbfa2) and RUNX2 (Cbfa1) transcription factors supports cooperative induction of skeletal development. J. Cell. Physiol. 2005;203:133–143. doi: 10.1002/jcp.20210. [DOI] [PubMed] [Google Scholar]
- Smits P, et al. The transcription factors L-Sox5 and Sox6 are essential for cartilage formation. Dev. Cell. 2001;1:277–290. doi: 10.1016/s1534-5807(01)00003-x. [DOI] [PubMed] [Google Scholar]
- Stricker S, Fundele R, Vortkamp A, Mundlos S. Role of Runx genes in chondrocyte differentiation. Dev. Biol. 2002;245:95–108. doi: 10.1006/dbio.2002.0640. [DOI] [PubMed] [Google Scholar]
- Tuan RS. Cellular signaling in developmental chondrogenesis: N-cadherin, Wnts, and BMP-2. J. Bone Jt. Surg., Am. 2003;85-A(2):137–141. doi: 10.2106/00004623-200300002-00019. [DOI] [PubMed] [Google Scholar]
- Vandesompele J, et al. Accurate normalization of real-time quantitative RT-PCR data by geometric averaging of multiple internal control genes. Genome Biol. 2002;3 doi: 10.1186/gb-2002-3-7-research0034. (RESEARCH0034) [DOI] [PMC free article] [PubMed] [Google Scholar]
- Wang X, Seed B. A PCR primer bank for quantitative gene expression analysis. Nucleic Acids Res. 2003;31:e1 54. doi: 10.1093/nar/gng154. [DOI] [PMC free article] [PubMed] [Google Scholar]
- Yates KE. Demineralized bone alters expression of Wnt network components during chondroinduction of post-natal fibroblasts. Osteoarthr. Cartil. 2004;12:497–505. doi: 10.1016/j.joca.2004.02.009. [DOI] [PubMed] [Google Scholar]
- Yates KE, Glowacki J. Altered expression of connective tissue genes in postnatal chondroinduced human dermal fibroblasts. Connect. Tissue Res. 2003a;44:121–127. doi: 10.1080/03008200390223891. [DOI] [PubMed] [Google Scholar]
- Yates KE, Glowacki J. Gene expression changes in an in vitro model of chondroinduction: a comparison of two methods. Wound Repair Regen. 2003b;11:386–392. doi: 10.1046/j.1524-475x.2003.11512.x. [DOI] [PubMed] [Google Scholar]
- Yates KE, Mizuno S, Glowacki J. Early shifts in gene expression during chondroinduction of human dermal fibroblasts. Exp. Cell Res. 2001;265:203–211. doi: 10.1006/excr.2001.5192. [DOI] [PubMed] [Google Scholar]
- Zakany R, et al. Protein phosphatase 2A is involved in the regulation of protein kinase A signaling pathway during in vitro chondrogenesis. Exp. Cell Res. 2002;275:1–8. doi: 10.1006/excr.2002.5487. [DOI] [PubMed] [Google Scholar]
- Zhao Q, Eberspaecher H, Lefebvre V, De Crombrugghe B. Parallel expression of SOX9 and Col2a1 in cells undergoing chondrogenesis. Dev. Dyn. 1997;209:377–386. doi: 10.1002/(SICI)1097-0177(199708)209:4<377::AID-AJA5>3.0.CO;2-F. [DOI] [PubMed] [Google Scholar]
- Zhou S, Glowacki J, Yates K. Comparison of TGF-b/BMP pathways signaled by demineralized bone powder and BMP-2 in human dermal fibroblasts. J. Bone Miner. Res. 2004;19:1732–1741. doi: 10.1359/JBMR.040702. [DOI] [PubMed] [Google Scholar]