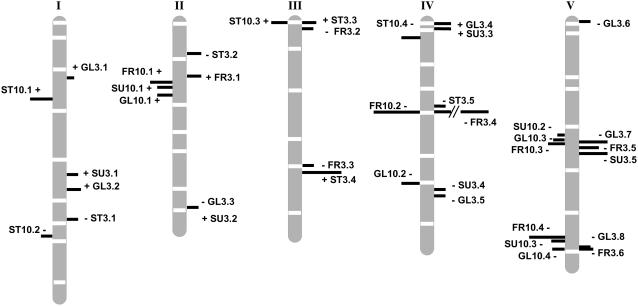
Figure 2.
QTLs detected for starch (ST), Glc (GL), Fru (FR), and Suc (SU) contents in the Bay-0 × Shahdara population. Each QTL is represented by a bar located at its most probable position (likelihood peak). QTLs detected on N+ (respectively, N−) are represented on the left (resp. right) side of chromosomes. The length of the bar is proportional to the QTL contribution to the phenotypic variation in the population (R2). The sign of the allelic effect is indicated for each QTL. The framework genetic map (indicating positions of the microsatellites markers) is from Loudet et al. (2002).

