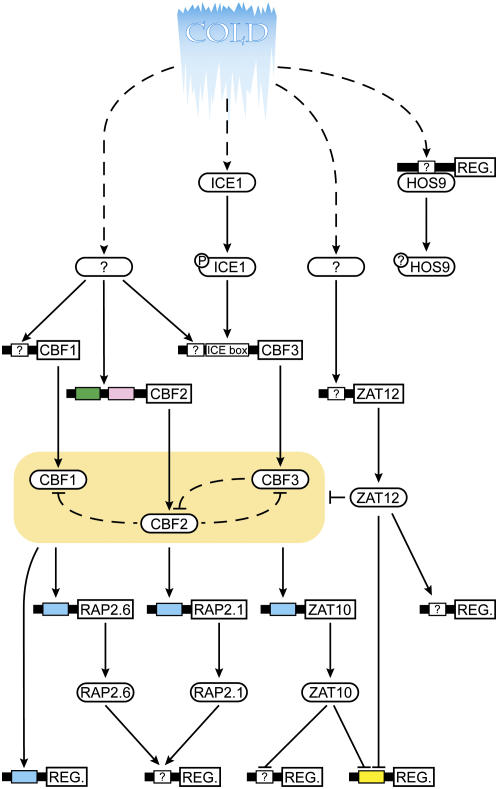
Figure 1.
Schematic representation of low temperature signal transduction assembled from reviews published by Chinnusamy et al. (2006) and Nakashima and Yamaguchi-Shinozaki (2006). Protein TFs are represented by ovals while TF regulons are represented by “REG” boxes. Where reported, the consensus sequences (cis-elements) bound by the upstream TF are shown as color-coded boxes within the promoter space (solid line) preceding the REG box or TF gene coding sequence (blue box, DRE; green box, ICEr1; pink box, ICEr2; and yellow box, EP2). Regulatory connections are mapped using triangular arrowheads to represent gene activation and flattened arrowheads to represent gene repression. Dashed arrows represent regulatory connections with experimental support but accomplished by unknown (and possibly posttranscriptional) mechanisms. Protein phosphorylation events, where known, are indicated by circles attached to the protein TFs. Genes modeled (and corresponding Arabidopsis Genome Initiative no.) are ICE1, AT3G26744; ZAT12, AT5G59820; HOS9, AT2G01500; CBF2, AT4G25470; CBF1, AT4G25490; CBF3, AT4G25480; ZAT10, AT1G27730; RAP2.1, AT1G46768; and RAP2.6, AT1G43160.

