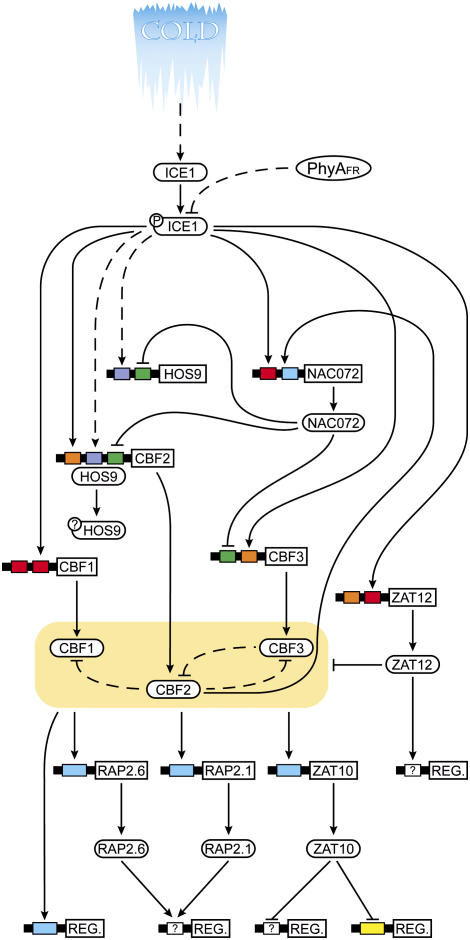
Figure 5.
Schematic representation of low temperature signal transduction. Solid arrows represent connections with at least two pieces of bioinformatic support (triangular arrowhead represents gene activation, flattened arrowhead represents gene repression). Dashed arrows represent regulatory connections with experimental/bioinformatic support but accomplished by unknown (and possibly posttranscriptional) mechanisms. Boxes represent cis-elements within the 500 bp promoters of the genes listed (ICE1, AT3G26744; ZAT12, AT5G59820; HOS9, AT2G01500; CBF2, AT4G25470; NAC072, AT4G27410; CBF1, AT4G25490; and CBF3, AT4G25480) and are color coded according to cis-element identity (red box, ICEr3; orange box, ICEr4; blue box, DRE; green box, ICEr1; purple box, I HOS9r1; and yellow box, EP2). Protein phosphorylation events, where known, are indicated by circles containing “P” attached to the protein TFs. Unknown types of posttranslational modification are indicated by circles containing “?” attached to the protein TFs. The ICEr4 element present in the CBF3 promoter contains the CCACGT core, but lacks an “H” in the first position.

