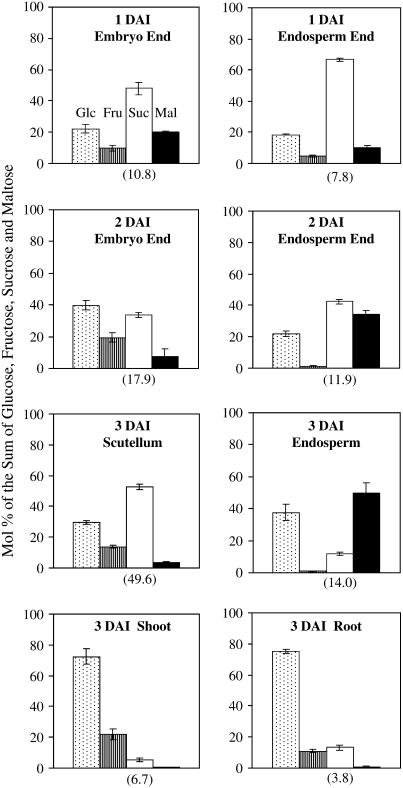
Figure 9.
Changes in sugar composition in wheat seedlings during early germination. Data are represented as mol % of the sum of Glc, Fru, Suc, and maltose (Mal); the means and sds calculated from three biological replicates, each of which contains six seedlings. The mean values of Suc concentration (μmol g−1 fresh weight) in the tissues are shown in parentheses below the Suc columns.

