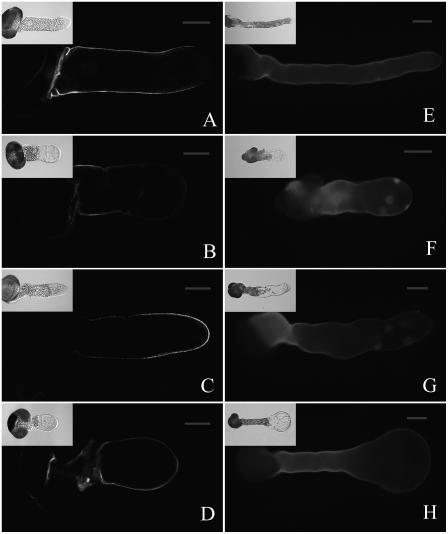
Figure 11.
Effects of MG132 treatment on the distribution of pectin and cellulose in pollen tubes. A to D, Pollen tubes cultured for 24 h. Controls (A and C) and MG132-treated (B and D) were labeled either with JIM5 (A and B) or with JIM 7 (C and D) and visualized by confocal microscopy. E to H, Pollen tubes stained with calcofluor and visualized by fluorescent microscopy. E, Control tube cultured for 28 h. F, Pollen tube treated with 40 μm MG132 for 24 h. G, Pollen tube treated with 40 μm MG132 for 28 h. H, Pollen tube was cultured under standard control conditions for 20 h and then treated with MG132 for additional 8 h. Inserts represent corresponding differential interference contrast images. Bars = 20 μm for A to D and 40 μm for E to H.

