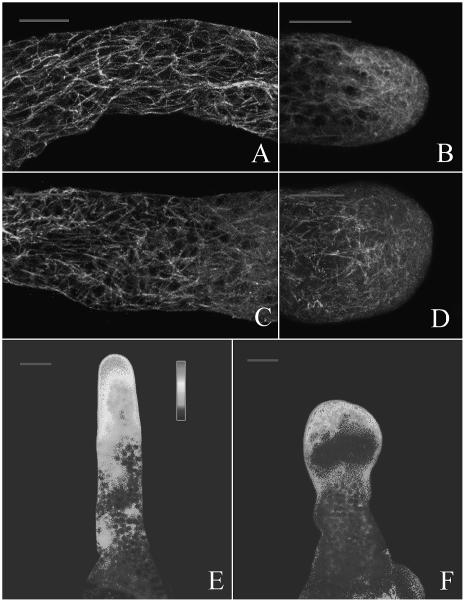
Figure 9.
Effects of MG132 on MTs and cytosolic Ca2+ gradient. A to D, Samples were chemically fixed and immunolabeled with anti-β-tubulin antibody. E to F, Samples cultured with 40 μm MG132 for 24 h and incubated with Fluo-3/AM. All samples were visualized by confocal microscopy. A and B, Control tubes cultured for 24 h. C and D, Tubes treated with 40 μm MG132 for 24 h. Note reorganization and partial disruption of MTs. E, Distribution of cytosolic Ca2+ in the control tube. F, Distribution of cytosolic Ca2+ in the MG132-treated tube. Bar = 20 μm.

