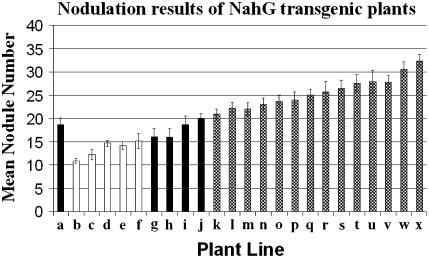
Figure 2.
Nodulation results of the NahG transgenic L. japonicus plants. Four-week-old plants were inoculated with 1 mL of a M. loti culture at an O.D.600 of 0.1. The plants were harvested 4 weeks postinoculation and nodule numbers enumerated. a, Wild type; b, GK1.9 T3; c, GB8.9P T3; d, GB3.14P T3; e, GB3.13 T3; f, GK6.1 T3; g, GH3 T2; h, GD14 T2; i, GH6 T2; j, GB4.9 T3; k, GI1.1 T3; l, GI3.11 T3; m, GB3B T3; n, GB3.8 T3; o, GI3.15 T3; p, GK6.6 T3; q, GK2.8 T3; r, GD9.6 T2; s, GB8.10 T3; t, GB8.19 T3; u, GI3.8 T3; v, GK3.6 T3; w, GK6.7 T3; and x, GK1.13 T3. It should be noted that plant lines generated from the same callus, and thus having the same letter designation, can vary genetically due to somoclonal variation and gene copy segregation. Plant lines marked with black, white, and checkered bars are statistically different groups. The lines with white bars have a mean nodule number significantly lower than the lines with black bars, α = 0.05 (using a Student's t test). The lines with black bars have a mean nodule number significantly higher than the lines with white bars, but are still significantly lower than the lines with checkered bars, α = 0.05. And finally, the lines with checkered bars have a mean nodule number statistically higher than the lines with black or white bars, α = 0.05. This figure represents data collected from three independent experiments where n = 30. Error bars represent se.

