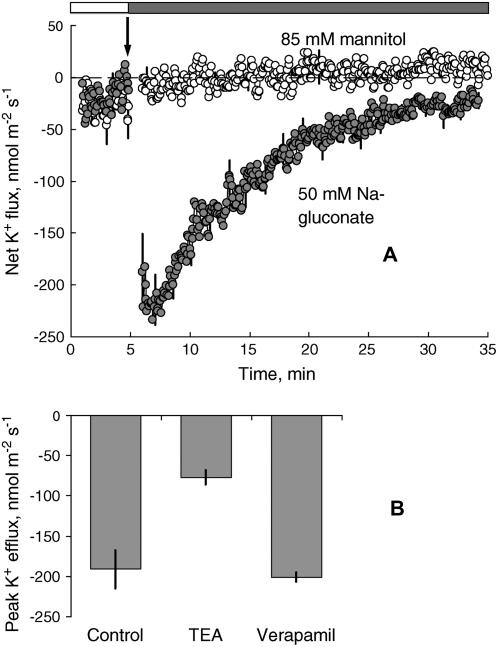
Figure 2.
Specificity and pharmacology of net K+ flux responses. A, Transient K+ fluxes in response to isotonic mannitol (white symbols) and sodium gluconate (gray symbols). Fluxes were measured from the mature epidermis of Arabidopsis wild-type roots after 1 to 1.5 h incubation in basic measuring solution. Data are mean ± se (n = 8). B, Effect of cation channel blockers (TEACl, 10 mm; verapamil, 20 μm) on the magnitude of the peak K+ efflux measured in response to 50 mm NaCl. Data are mean ± se (n = 6–8).

