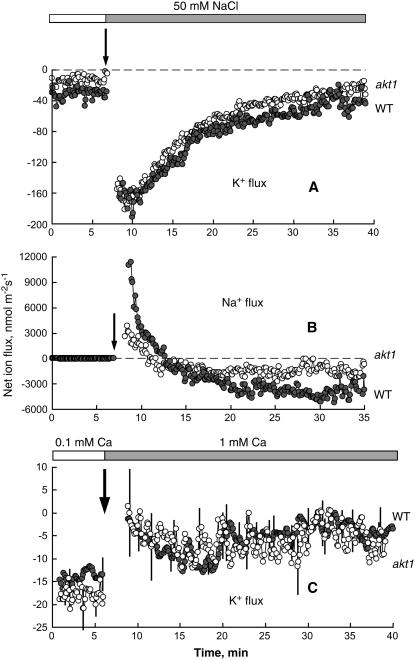
Figure 5.
A and B, Salinity-induced net K+ (A) and Na+ (B) flux kinetics measured from mature root epidermis of Arabidopsis wild-type (gray symbols) and akt1 (white symbols) plants. Roots were incubated in basic measuring solution for about 1 h before 50 mm NaCl was added. Data are mean ± se (n = 6–9). C, Effect of supplemental Ca2+ on net K+ fluxes measured from the mature epidermis of Arabidopsis wild-type (gray symbols) and akt1 (white symbols) roots in the presence of 50 mm NaCl. Data are mean ± se (n = 6–8). Roots were exposed to salinity in low Ca2+ (0.1 mm) solution for 3 h prior to Ca2+ treatment.

