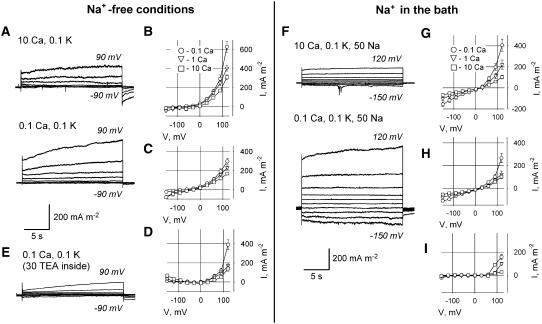
Figure 6.
Whole-cell plasma membrane currents in protoplasts derived from Arabidopsis mature root epidermis in control (Na+-free) conditions (A–E) and in 50 mm extracellular Na+ solution (F–I). A, Typical currents (recorded from the same protoplast) in 10 mm (top) and 0.1 mm (bottom) extracellular Ca2+ in control solution. B to D, Mean ± se I-V relationships (n = 4–9) for total (B), instantaneous (C), and time-dependent (D) currents measured at 0.1, 1, and 10 mm extracellular Ca2+ in Na+-free solution. F, Typical currents (recorded from the same protoplast) in 10 mm (top) and 0.1 mm (bottom) extracellular Ca2+ with 50 mm Na+ present in the bath. G to I, Mean I-V relationships (n = 5–6) for total (G), instantaneous (H), and time-dependent (I) currents measured at 0.1, 1, and 10 mm extracellular Ca2+ in the presence of 50 mm Na+ in the bath. Time-dependent currents were calculated as described in “Materials and Methods.” In all sections except E, PS contained 50 mm potassium gluconate and 30 mm KCl. E, Typical currents in 0.1 mm extracellular Ca2+ when K+ salts in PS were replaced by 30 mm TEACl. Extracellular K+ was 0.1 mm throughout. All concentrations are given in mm.

