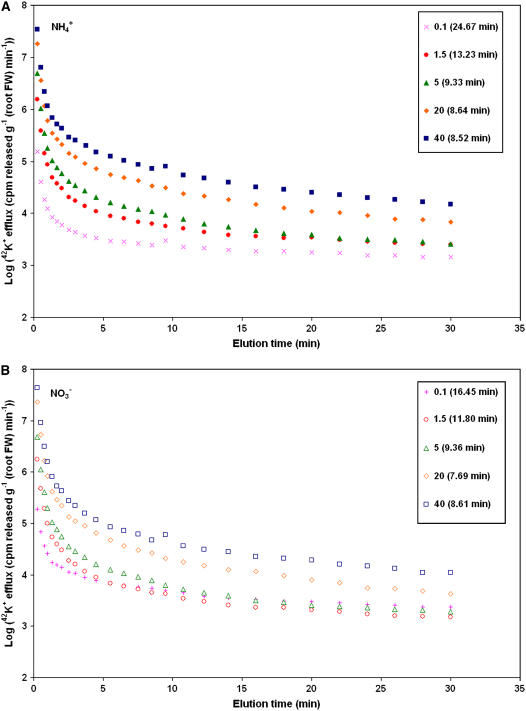
Figure 1.
Comparison of 42K+ efflux patterns, as determined by tracer elution, in roots of barley seedlings grown under five K+ concentrations and two N treatments, NH4+ (A) and NO3− (B). Plots have been corrected for differences in root mass and tracer activity (to the arbitrary value of 2 × 10⁵ cpm μmol−1). Each point is the mean ± SEM of six to 17 replicates (SEM was, on average, <11% of the mean). Cytosolic exchange half-times are listed in parentheses (SEM < 15% of the mean).

