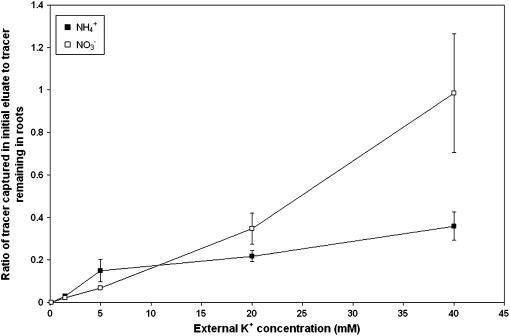
Figure 4.
Ratio of 42K+ captured in the initial eluate during a subsampling protocol to tracer remaining in roots after elution. Values are corrected for root mass and tracer activity. Black squares refer to seedlings grown with NH4+; white squares refer to NO3−. Each point is the mean ± SEM of three to 16 replicates.

